Arranging Freq and Count Plot by same sample #18
Description
Hi,
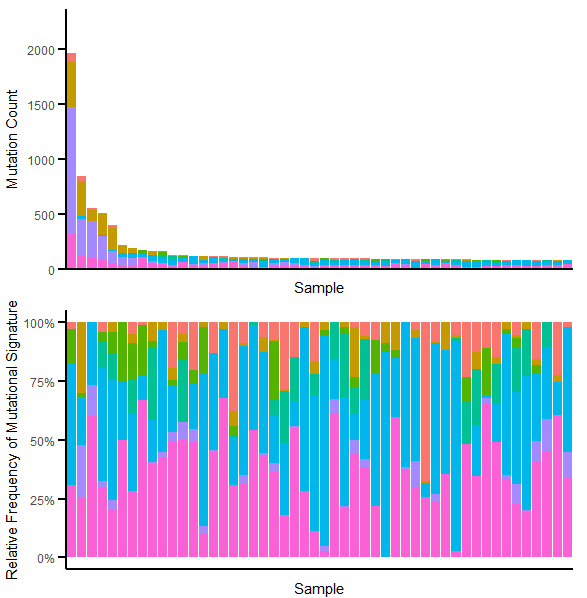
I have been exploring the package and so far it has been very useful (specially since it is my first time working with mutational signatures). I generated the freq/Count of a number of selected COSMIC signatures in my cohort and displayed in the plot below.
I noticed the msigPlot function arranges each sample by descending count, but when the frequency is plotted I think it end up being arranged by a different factor. Is there a way to ensure both plots are arranged in the same fashion (or is it even relevant?).
I also wanted to ask if you have any documentation on how to compare specific signatures between two cohorts of patients.
Thanks a lot in advance,
Mateo Mejia