ML. Simple example of decision trees and information gain
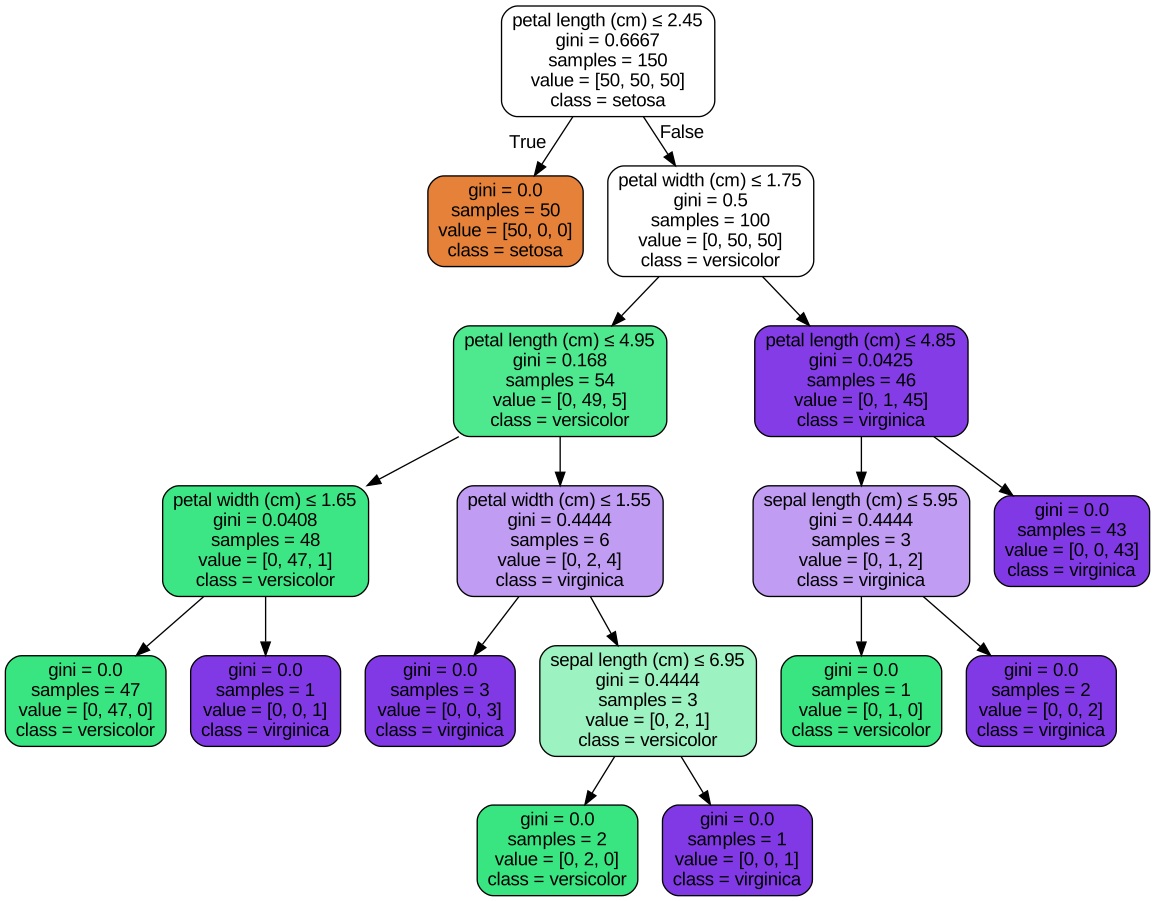
A decision tree is a flowchart-like structure in which each internal node represents a "test" on an attribute (e.g. whether a coin flip comes up heads or tails), each branch represents the outcome of the test, and each leaf node represents a class label (decision taken after computing all attributes). The paths from root to leaf represent classification rules.
In decision analysis, a decision tree and the closely related influence diagram are used as a visual and analytical decision support tool, where the expected values (or expected utility) of competing alternatives are calculated.
A decision tree consists of three types of nodes:[1]
Decision nodes – typically represented by squares Chance nodes – typically represented by circles End nodes – typically represented by triangles Decision trees are commonly used in operations research and operations management. If, in practice, decisions have to be taken online with no recall under incomplete knowledge, a decision tree should be paralleled by a probability model as a best choice model or online selection model algorithm. Another use of decision trees is as a descriptive means for calculating conditional probabilities.
Decision trees, influence diagrams, utility functions, and other decision analysis tools and methods are taught to undergraduate students in schools of business, health economics, and public health, and are examples of operations research or management science methods. For more information see: https://en.wikipedia.org/wiki/Decision_tree