We can explain Machine Learning Models without discussing Statistical Modelling From Wikipedia, statistical model is a mathematical model that embodies a set of statistical assumptions concerning the generation of sample data (and similar data from a larger population). A statistical model represents, often in considerably idealized form, the data-generating process.
Statistical modelling is a method of mathematically approximating the world. Statistical models contain variables that can be used to explain relationships between other variables. We use hypothesis testing, confidence intervals etc to make inferences and validate our hypothesis. Machine learning is all about results, it is like working in a company where your worth is characterized solely by your performance. Whereas, statistical modeling is more about finding relationships between variables and the significance of those relationships, whilst also catering for prediction.
- Recognition and Classification of Objects: Training a Machine Learning Model helps to label/annotate data and make right decisions. For an example, if you want your algorithm to recognize these two different species of animals — say a cat and dog, you need labeled images containing these two class of animals. When your algorithm learns what are the features are important in distinguishing between two classes. It helps them to recognize and classify the similar objects in future, thus training data is very important for such classification. And if it is not accurate it will badly affect the model results, that can become the major reason behind the failure of AI project.
From Wikipedia, In mathematics and computer science, an algorithm is a finite sequence of well-defined, computer-implementable instructions, typically to solve a class of problems or to perform a computation. The study of algorithms that improve automatically through experience and by the use of data is called Machine Learning. What this means is that instead of telling the computer what to do when something happen in the algorithm, you just give the computer a bunch of data and you allow it automatically fine-tune the algorithm such that it performance for that specific task improves.
- Validating the Machine Learning Model: Developing a ML model is not enough, you need to validate the model to check its accuracy/RMSE, so that you can ensure the prediction quality in real-life. To evaluate such ML model, you need another set of training data which can be also called the validation data, use to check the accuracy level/RMSE of the model in different scenario and to ensure the model generalize well.
Modelling is a form of estimation (approximation). When you are able to estimate something, you are able to prepare for it. For example, you and your family members wants to have dinner and you are to prepare the nutritious meal, given the number of people (family members) present in the house you estimated that 15 cups of Rice will be enough to fill everybody stomach. Now you need a way to measure if your estimate is good enough or close then you evaluate the estimate by cooking the food (15 cups of rice) and you serve everybody and still have some cooked rice in the pot. That is Modelling and Evaluation. It has helped you create an estimate for the cup of rice you should prepare for the number of family member present in the house.
-
Supervised Learning How it works: This algorithm consist of a target / outcome variable (or dependent variable) which is to be predicted from a given set of predictors (independent variables). Using these set of variables, we generate a function that map inputs to desired outputs. The training process continues until the model achieves a desired level of accuracy on the training data. Examples of Supervised Learning: Regression, Decision Tree, Random Forest, KNN, Logistic Regression etc.
-
Unsupervised Learning How it works: In this algorithm, we do not have any target or outcome variable to predict / estimate. It is used for clustering population in different groups, which is widely used for segmenting customers in different groups for specific intervention. Examples of Unsupervised Learning: Apriori algorithm, K-means.
-
Reinforcement Learning: How it works: Using this algorithm, the machine is trained to make specific decisions. It works this way: the machine is exposed to an environment where it trains itself continually using trial and error. This machine learns from past experience and tries to capture the best possible knowledge to make accurate business decisions. Example of Reinforcement Learning: Markov Decision Process
- Linear Regression
- Logistic Regression
- Decision Tree
- SVM
- Naive Bayes
- kNN
- K-Means
- Random Forest
- Dimensionality Reduction Algorithms
- Gradient Boosting algorithms
The article attached here explain all you need to know about all the listed algorithm, how, when and why we use them.
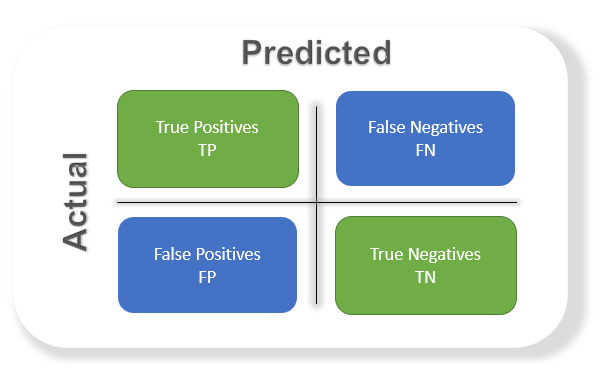
True positives (TP): Predicted positive and are actually positive.
False positives (FP): Predicted positive and are actually negative.
True negatives (TN): Predicted negative and are actually negative.
False negatives (FN): Predicted negative and are actually positive
- Confusion matrix: is just a matrix of the above evaluation metrics
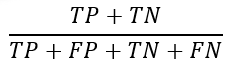
- Accuracy: the most commonly used metric to judge a model and is actually not a clear indicator of the performance. The worse happens when classes are imbalanced.
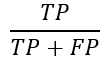
- Precision: Percentage of positive instances out of the total predicted positive instances. Here denominator is the model prediction done as positive from the whole given dataset. Take it as to find out ‘how much the model is right when it says it is right’.
- Recall/Sensitivity/True Positive Rate: Percentage of positive instances out of the total actual positive instances. Therefore denominator (TP + FN) here is the actual number of positive instances present in the dataset. Take it as to find out ‘how much extra right ones, the model missed when it showed the right ones’.

- F1-Score: it is the harmonic mean of both the Precision and Recall. One drawback is that both precision and recall are given equal importance due to which according to our application we may need one higher than the other and F1 score may not be the exact metric for it. Therefore either weighted-F1 score or seeing the PR or ROC curve can help.

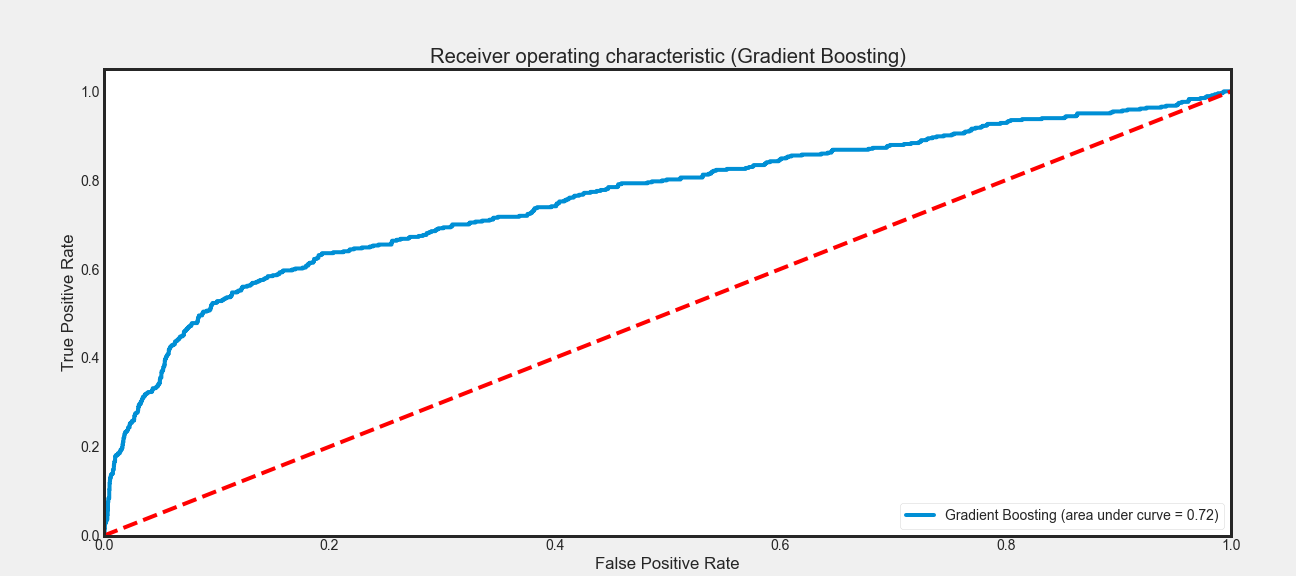
- ROC curve: ROC stands for receiver operating characteristic and the graph is plotted against TPR and FPR for various threshold values. As TPR increases FPR also increases. Learn More about Machine Learning Evaluation Metrics (Classification) here
-
Mean Absolute Error (MAE): The simplest measure of forecast accuracy is called Mean Absolute Error (MAE). MAE is simply, as the name suggests, the mean of the absolute errors. The absolute error is the absolute value of the difference between the forecasted value and the actual value. MAE tells us how big of an error we can expect from the forecast on average. One problem with the MAE is that the relative size of the error is not always obvious. Sometimes it is hard to tell a big error from a small error. To deal with this problem, we can find the mean absolute error in percentage terms.
-
Mean Absolute Percentage Error (MAPE): The mean absolute percentage error (MAPE) is a statistical measure of how accurate a forecast system is. It measures this accuracy as a percentage, and can be calculated as the average absolute percent error for each time period minus actual values divided by actual values.
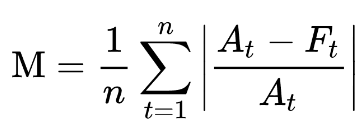
Where
M = mean absolute percentage error
n = number of times the summation iteration happens
A_t = actual value
F_t = forecast value
- Mean Squared Error (MSE): the mean squared error (MSE) or mean squared deviation (MSD) of an estimator (of a procedure for estimating an unobserved quantity) measures the average of the squares of the errors that is, the average squared difference between the estimated values and the actual value.

- Root Mean Squared Error (RMSE): The regression line predicts the average y value associated with a given x value. Note that is also necessary to get a measure of the spread of the y values around that average. To do this, we use the root-mean-square error (r.m.s. error).
To construct the r.m.s. error, you first need to determine the residuals. Residuals are the difference between the actual values and the predicted values.
They can be positive or negative as the predicted value under or over estimates the actual value. Squaring the residuals, averaging the squares, and taking the square root gives us the r.m.s error. You then use the r.m.s. error as a measure of the spread of the y values about the predicted y value.

Note that the list of Evaluation metrics for both classification and regression problems is not exhaustive, there are some others that were not mentioned.
- Beginner
- Can build ML models and evaluate it
- Knows about model parameter and can tune them blindly
- Expert
- possess the ability to build model that generalize well
- possess the ability to perform hyper-parameter tuning automatically using tools like OptunaAI
- can interpret model results
- can detect models problems (Overfitting, Underfitting)
- knows how to stack model