
The objective of this lab is to emulate an enterprise Active Directory environment, focused on 1 main Domain Controller and one joined endpoint with Administrator accounts and a mock employee account. The 2 Windows machines were each configured with Splunk Universal Forwarders to provide the capability to forward event log telemetry to the SIEM instance. A Linux Ubuntu Server instance with Splunk Enterprise SIEM was configured to collect telemetry generated from these machines. SIEM configurations included a custom index and custom alert, with SPL written specifically to alert for activity related to unauthorized successful remote logon events from networks outside the expected private IP range. Alerts triggered by these events were aggregated and forwarder to a SOAR platform, Shuffle, and using simple Webhook and Slack App nodes, forwarded key and relevant information to a dedicated Slack bot to be posted into a dedicated Slack channel for timely analysis and response.
- Architecture
- Detection Engineering
- Shuffle SOAR Integration
- Troubleshooting and Lessons Learned
- Security Considerations
- Future Improvements
- Conclusion
- Windows Server 2022 Active Directory Domain Controller
- Splunk Universal Forwarder
- Windows Server 2022 Active Directory Domain Controller
- Splunk Universal Forwarder
- Linux Ubuntu Server (Splunk Enterprise SIEM)
- Shuffle SOAR
- Slack
- pfSense (NTP Server + network segmentation)
- Linux Mint (SSH + RDP with Remmina)
Note: Each VM was manually provisioned with necessary vCPUs, RAM, NICs, and disk storage. Templates can be leveraged for a faster and more consistent process.
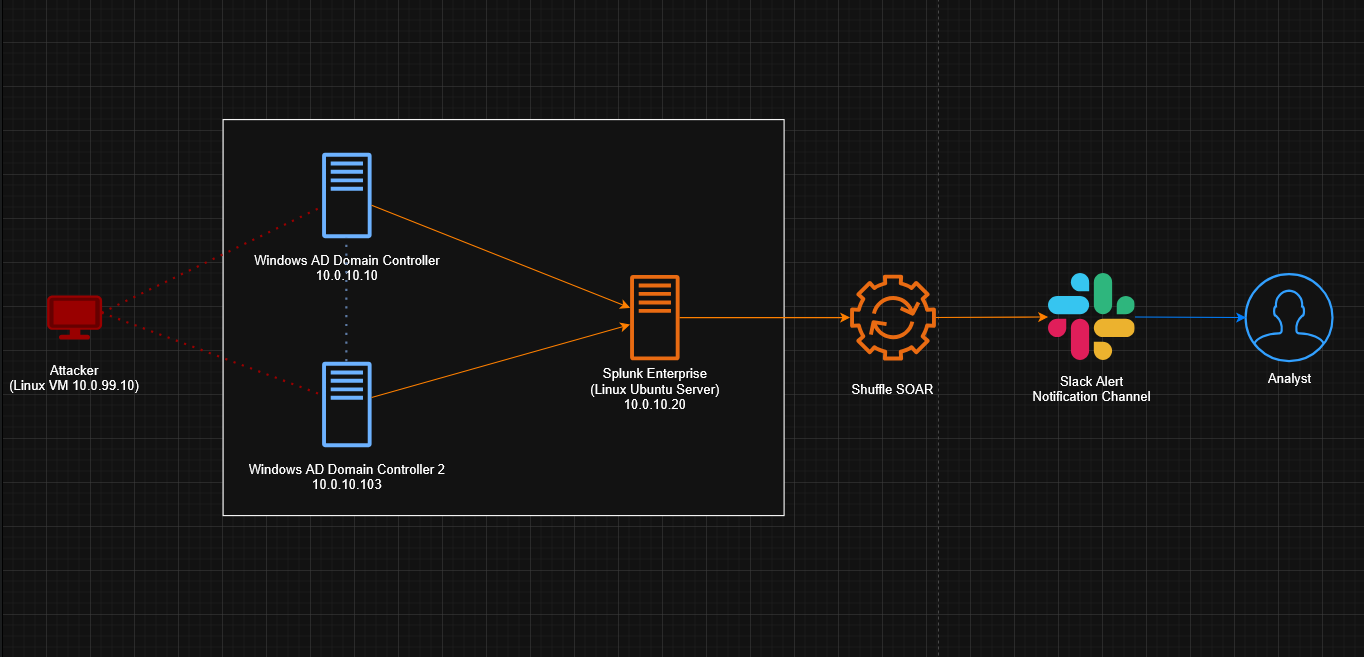
Provision and configure 2 Windows Server 2022 instances and 1 Linux Ubuntu Server instance.
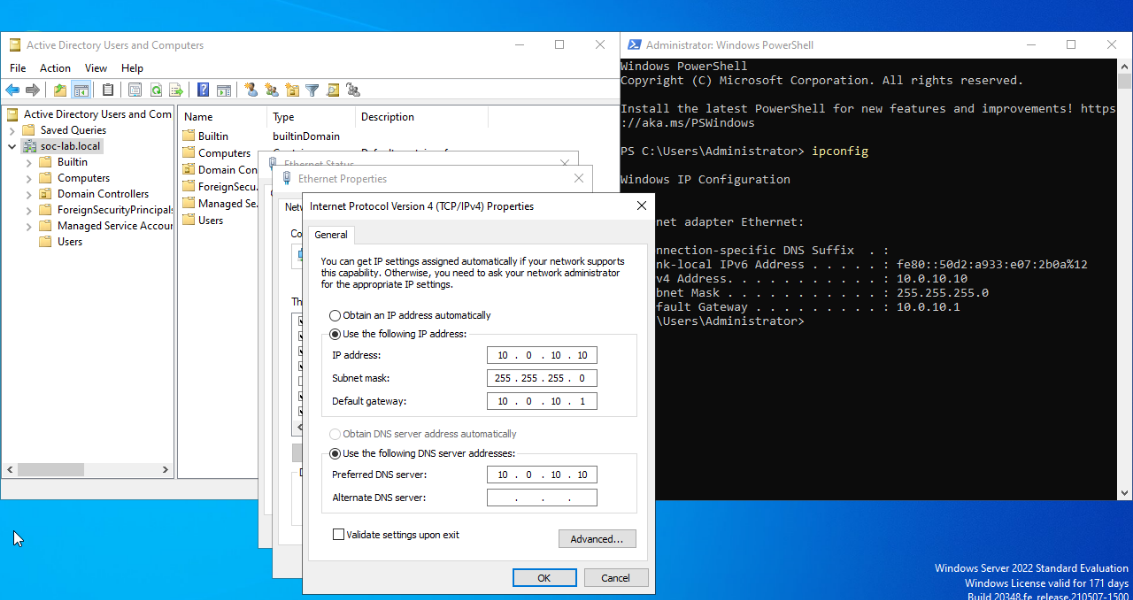
On the main Windows Server 2022 instance, statically configure:
Network & Internet Settings>Change adapter options>Ethernet Interface 0>Properties>Internet Protocol Version 4 (TCP/IPv4
IPv4 address: 10[.]0[.]10[.]10
Subnet mask: 255[.]255[.]255[.]0
Gateway: 10[.]0[.]10[.]1

Preferred DNS: 10[.]0[.]10[.]10
Connectivity test:
ping 10[.]0[.]99[.]1 (Firewall)
ping 8[.]8[.]8[.]8 (External IP)
ping google[.]com (DNS Resolution)
Next, install Active Directory and promote the instance to Domain Controller.
In Server Manager:
Add roles and features>Server Roles
Select:
Active Directory Domain Services>Add Features
Install.
In the Active Directory Domain Services Configuration Wizard, Add a new forest.
Domain name: soc-lab.local.
Install.
In search, Active Directory Users and Computers.
Expand the new domain forest. Navigate to Users, right-click, New>User.
Mock employee information: First name: Adam Last name: Adamson User logon name: aadamson@socl-lab[.]local
In search, Allow remote connections to this computer>Show Settings. Ensure Allow remote connections to this computer` is checked.
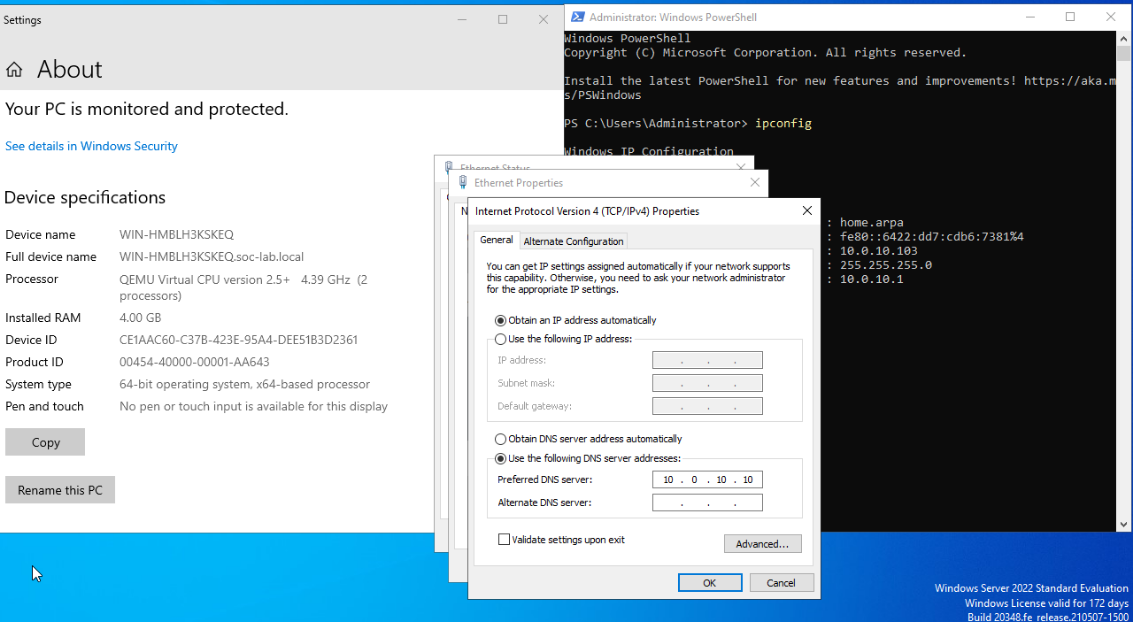
On the second Windows Server 2022 instance:
Network & Internet Settings>Change adapter options>Ethernet Interface 0>Properties>Internet Protocol Version 4 (TCP/IPv4
We can allow an automatic IP address via DHCP and manually set the preferred DNS server address as the Active Directory Domain Controller, 10[.]0[.]10[.]10.
Connectivity test:
ping 10[.]0[.]10[.]1 (Firewall)
ping 8[.]8[.]8[.]8 (External IP)
ping google[.]com (DNS Resolution)
Next, join the machine to the AD domain, and authenticate using the mock employee's account.
In search, This PC>Properties then Rename this PC (advanced)>Change>Member of Domain and enter soc-lab then login with the domain Administrator information.
Restart.
Login as Administrator.
In search, Allow remote connections to this computer>Show Settings>Select Users>Add
Enter mock employee's information, aadamson and click Check Users to populate the information. OK and exit.
For the Linux Ubuntu Server Splunk installation, configuration and use, I will utilize a Linux Mint VM to SSH into the Ubuntu Server instance.
On the Linux Ubuntu Server instance:
IPv4 address: 10[.]0[.]10[.]20
Subnet mask: 255[.]255[.]255[.]0
Gateway: 10[.]0[.]10[.]1
DNS server: 10[.]0[.]10[.]1, 8[.]8[.]8[.]8
Connectivity test:
ping -c 4 10[.]0[.]99[.]1 (Firewall)
ping -c 4 8[.]8[.]8[.]8 (External IP)
ping -c 4 google[.]com (DNS Resolution)
Configuration:
sudo apt update && sudo apt upgrade -y
From the Linux Mint VM:
Copy the wget link from the Splunk official site, in this case for Linux.
Paste the command into the terminal and download Splunk Enterprise.
Install the download:
sudo dpkg -i <splunk-9.x..deb>
After installation, start the service:
sudo /opt/splunk/bin/splunk start
Since I was not running as root, --run-as-root had to be appended at the end of each start/stop command related to Splunk. This could be avoided by switching to root:
sudo -i
Create an administrator account as prompted. The web interface should be available at the (Linux Ubuntu Server) local host IP.
In a web browser:
hxxp://localhost[:]8000
Note: Possible firewall configurations may be necessary to allow traffic flow and GUI generation. This can be done with the following command:
ufw allow 8000
Under the Administrator option in the top panel, the time zone was set to UTC.
Note: All machines in the lab are configured to sync with the pfSense firewall, which serves as the local NTP server. NTP server configuration and synchronization steps will be listed below in the Troubleshooting and Lessons Learned section.
Under Apps>Find More Apps, we will search for and install the Splunk Add-on for Microsoft Windows add-on since we are working with Microsoft Windows Server 2022 instances.
In Settings>Indexes we will create a New Index.
Index Name: soc-lab-ad

All other settings left as default.
Save.
In Settings>Forwarding and receiving>Configure receiving select New Receiving Port and enter:
Listen on this port: 9997
Save.
Note: Possible firewall configurations may be necessary to allow traffic flow to the listening port. This can be done with the following command:
ufw allow 9997
On each Windows Server 2022 machine, navigate to the Splunk official site and retrieve the Splunk Universal Forwarder downloads.
Follow the installation steps as applicable to the machine it is being installed on.
For the Receiving Indexer:
Hostname or IP: 10[.]0[.]10[.]20 (Linux Ubuntu Server Splunk VM)
Port: 9997
Install.
Navigate to System Drive (C:)>Program Files>SplunkUniversalForwarder>etc>system>default
Retrieve the inputs.conf file and paste it into the System Drive (C:)>Program Files>SplunkUniversalForwarder>etc>system>local directory.
Open Notepad with Run as Administrator.
Locate the inputs.conf file we just pasted into the ..\local\ directory and add the following at the bottom of the file:
[WinEventLog://Security]
index = soc-lab-ad
disabled = false
Save.
In search, open Services with Run as Administrator, locate the SplunkForwarder service.
In Properties>Log On, ensure the following is set:
Log on as:
Local System account
Apply then restart service.
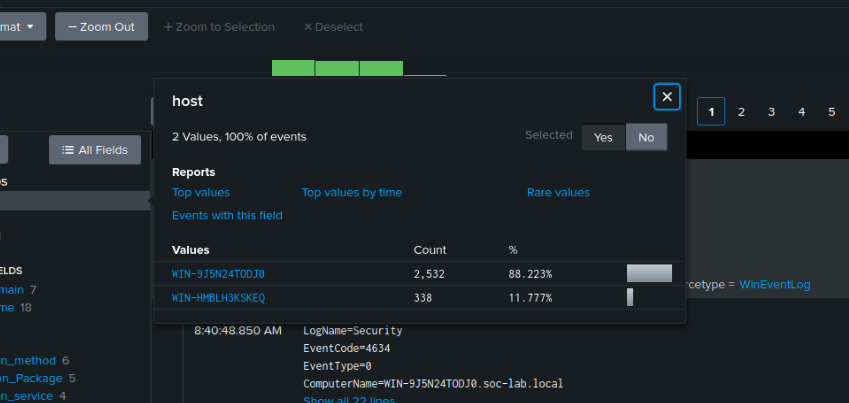
Telemetry from each host should now populate within the Splunk SIEM web GUI.
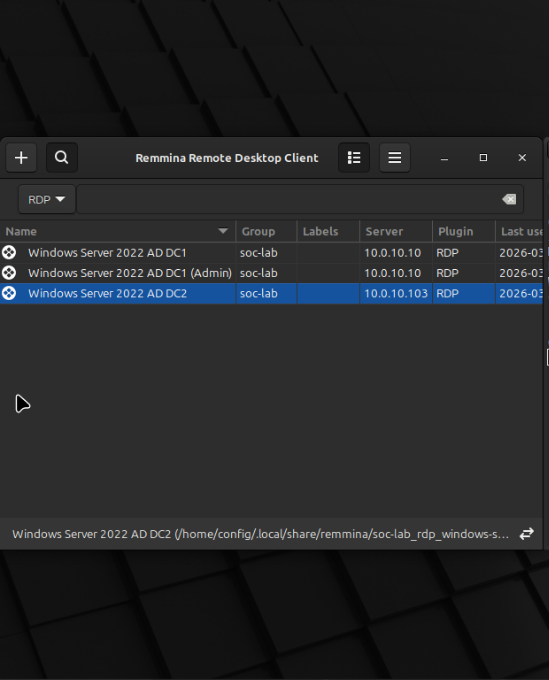
On the Linux Mint VM used for configuration and SSH, install and configure the Remmina service to enable RDP capabilities. Since the RDP connection is going from a Linux machine to a Windows machine, the installation process is as follows:
sudo apt install remmina remmina-plugin-rdp -y
After installation, launch:
remmina
3 connection profiles were created, only 2 were used.
The first connection profile:
Protocol: RDP
Server: 10[.]0[.]10[.]10
Username: Administrator
Password: <password>
The second connection profile
Protocol: RDP
Server: 10[.]0[.]10[.]103
Username: aadamson
Password: <password>
These allowed me to generate telemetry on both Windows VMs in order to trigger alerts as desired from the Linux VM
For the purposes of this lab, https://www.ultimatewindowssecurity.com/ was referenced to specify the Logon Type portion related to Windows Event ID 4624. Here we can see under the Logon Type section that types 7 and 10 will be the most relevant for our SPL alert query.
Our SPL alert query will be crafted to detect Windows Security Event ID 4624, Logon Types 7 or 10 to focus on RDP logons, and source IPs that are external to the specific VLAN in which the Windows instances reside in, the 10[.]0[.]10[.]0/24 VLAN.
Note: This portion of the SPL:
| eval _time=strftime(_time, "%Y-%m-%d %H:%M:%S UTC")
..exists to convert the time from Epoch into human-readable UTC time for the sake of the Slack channel output.
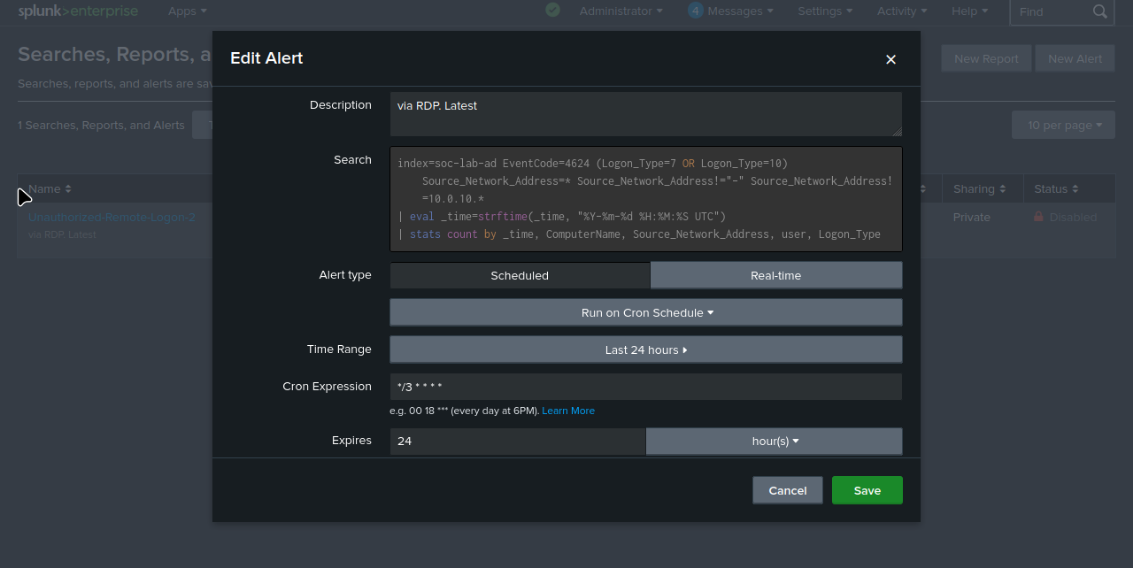
For this lab, I chose to use a Run on Cron Schedule setting with the following:
Cron Expression: */3 * * *
This format runs the alert every 3 minutes, which was beneficial for my goals of quickly generating consistent and relevant telemetry without flooding the Slack channel. The cron expression can be adjusted as necessary depending on the desired goals of the environment in which it is designed for.
Trigger was set to For each result with the Throttle option enabled since all of my telemetry was generated from a single host.
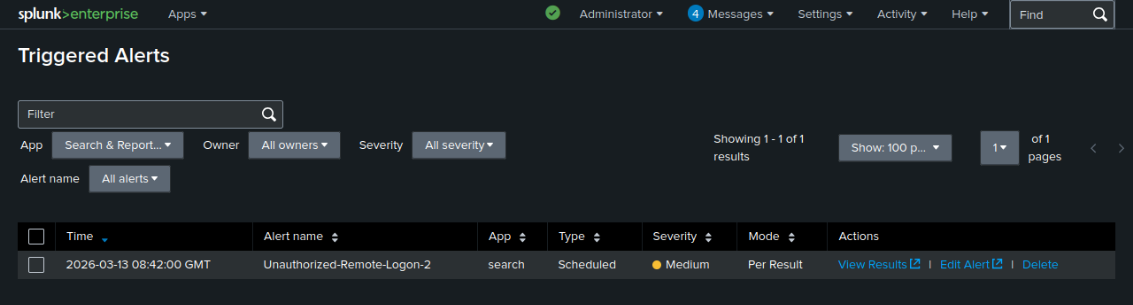
When triggered was configured to Add to Triggered Alerts with the default Medium severity. Telemetry was then verified in the Triggered Alerts menu.
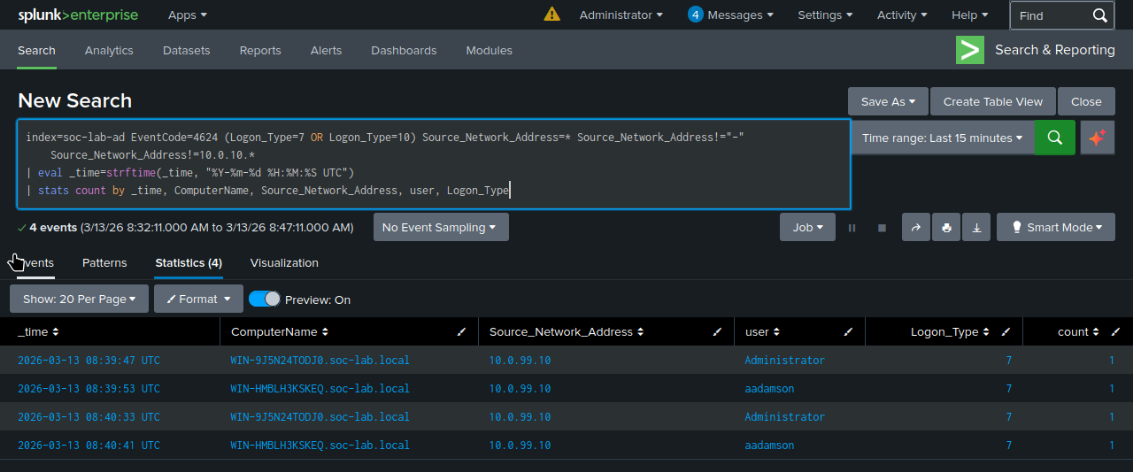
Using the Shuffle SOAR Webhook node's Webhook URI, we can configure our Splunk alert, located in Apps>Search & Reporting>Alerts, and add an option for the Webhook by using Add Actions in the When triggered section. By pasting in the Webhook URI, the Shuffle node will now receive the telemetry generated directly from the alert in the Splunk SIEM.
To enable, click on the node:
Start
This node requires authentication from an active Slack account, along with a valid workspace.
On the Slack site, api[.]slack[.]com/apps, select Create New App>From Scratch and configure:
App Name: Splunk-Alerts
Workspace: JAD-LABS
Then, enable bot permissions in the Features>OAuth & Permissions>Bot Token Scopes section:
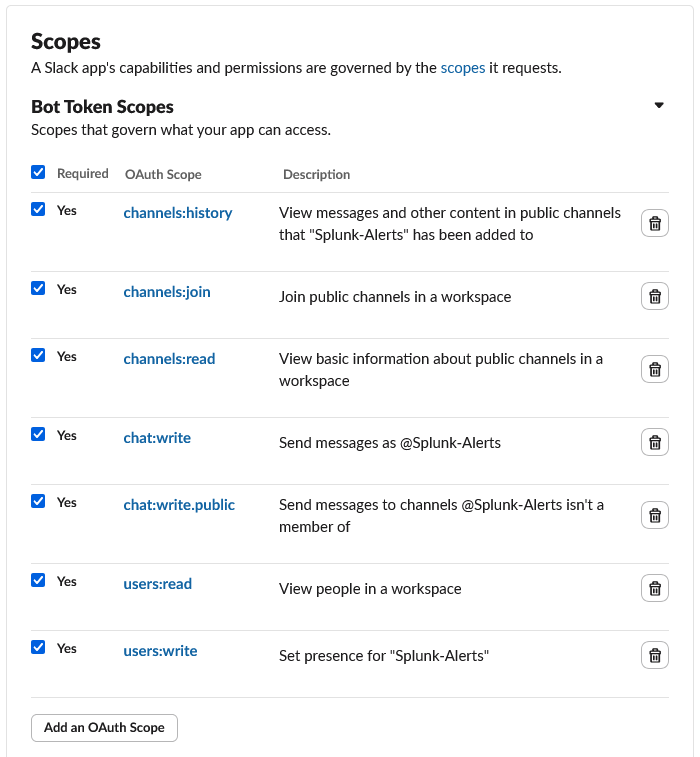
Within the OAuth & Permissions section, select Install App to Workspace and Slack will generate a Bot User OAuth Token.
In the Slack Workspace, create a new channel dedicated to Shuffle SOAR telemetry output:
ad-lab-main
Back on Shuffle, click on the Slack App node, + Authenticate slack and enter the relevant Client ID and Client Secret generated from the Slack App creation site.
Connect the Webhook to the Slack App, and set the node to chat.postMessage.
In order to generate Slack App node runtime variables, the Webhook must be set to Start and a mock event must trigger the alert, which will be forwarded to the Webhook and sent to the now connected Slack App node to use to generate the runtime variables.
After doing this once, we can utilize the runtime variables and format the output that will appear on the Slack channel in an organized manner.
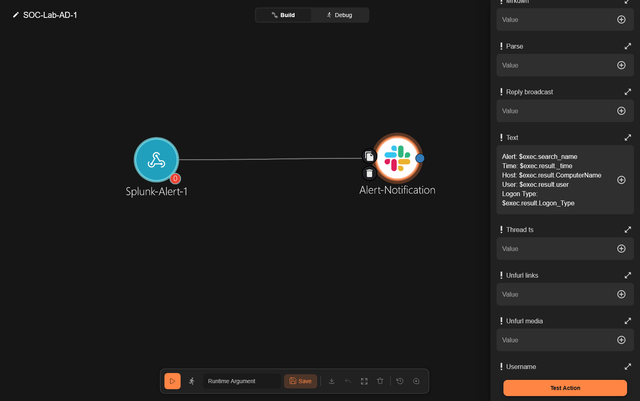
With the message formatted and the Slack App node Channel field set to ad-lab-main, corresponding to our designated Slack workgroup channel, alerts from Splunk are now populated in the Slack channel via the configured bot.
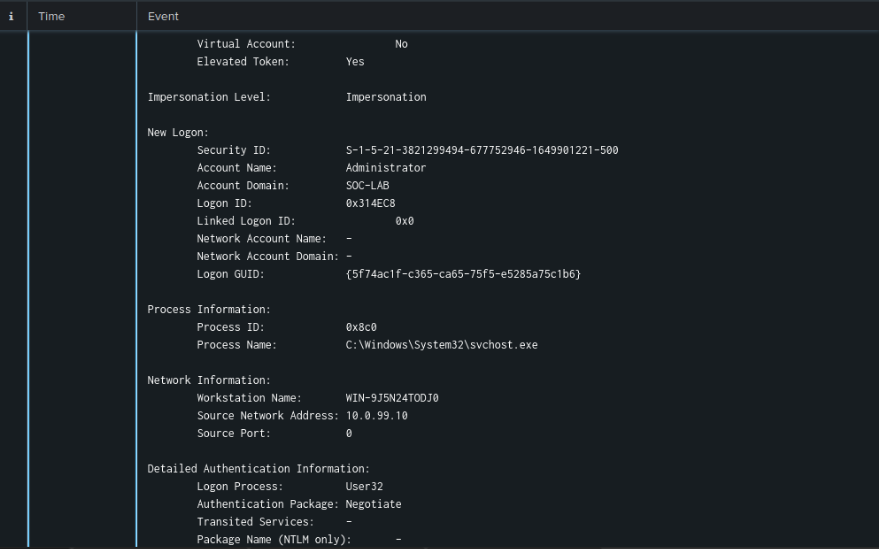
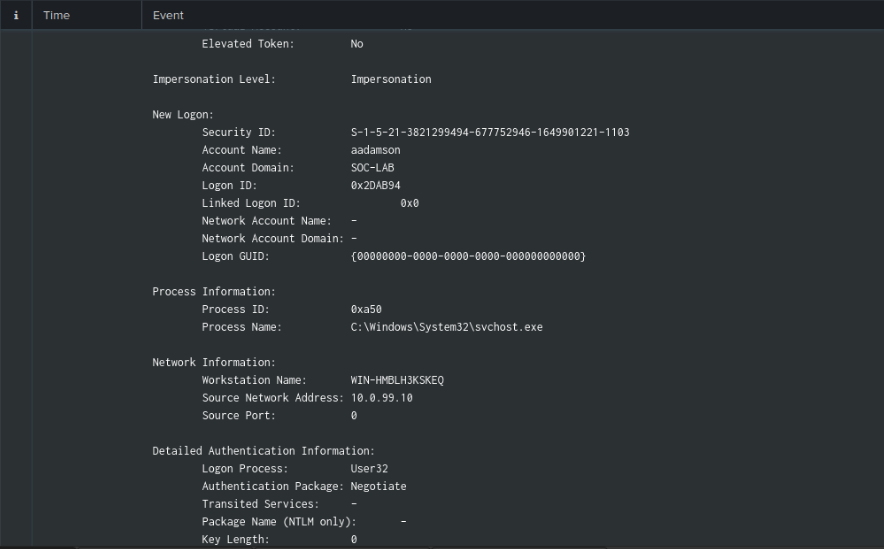
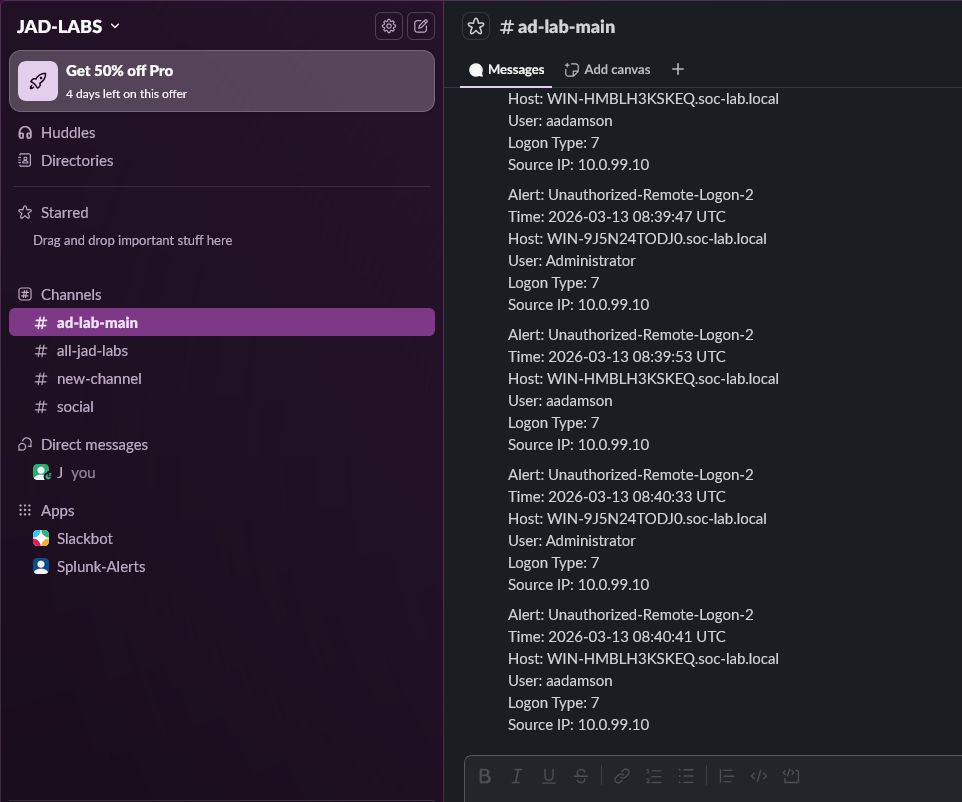
Below are 2 distinct logs of remote logons that triggered alerts:
Telemetry populated in Slack:
In pfSense, the NTP service was configured to allow all relevant VMs in the lab to synchronize to the UTC time zone for accurate telemetry and ingestion.
In the pfSense GUI:
Services>NTP>Settings
Interface: LAN

Time Servers:
0.pool.ntp.org
1.pool.ntp.org
2.pool.ntp.org
time.cloudflare.com
time.google.com
Save.
In Services>DHCP Server:
NTP Server 1: 10[.]0[.]99[.]1
This IP address is the LAN interface of the pfSense firewall. Configuring this setting in the DHCP section allows configuration of the NTP server along with the DHCP assignment process.
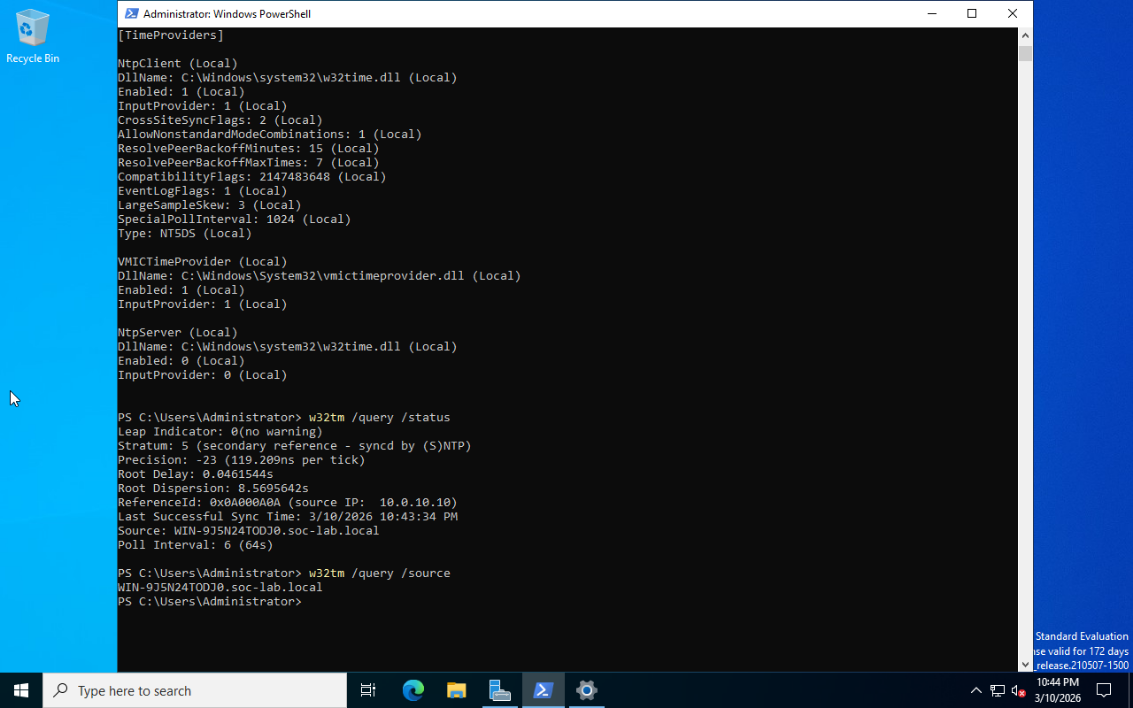
In the lab, the main Active Directory Server instance was configured to utilize the pfSense NTP service, with a firewall configuration to open port 123 between pfSense and the server. The second Windows VM joined to the main Domain Controller was configured to synchronize with the Domain Controller to receive NTP configuration:
Configuration settings for Linux Ubuntu Server:
timedatectl status
sudo nano /etc/systemd/timesyncd.conf
[Time]
NTP=10[.]0[.]99[.]1
FallbackNTP=0[.]pool[.]ntp[.]org, 1[.]pool[.]ntp[.]org, time[.]cloudflare[.]com
sudo systemctl restart systemd-timesyncd
During mock telemetry generation tests, there was a point where the Slack channel would receive output from the Slack App node in Shuffle, however, that output was either the same initial test event constantly repeated or the format template without any dynamically populated output.
Example output:
Alert:
Time:
Host:
User:
Logon Type:
Source IP:
After extensive reading of the SOAR documentation and much experimentation with Python code execution nodes, manually configured runtime variables, etc., I discovered the root cause(s) to be 2 errors:
-
The Shuffle SOAR workflow was stuck referencing the test runtime variables and I simply had to rebuild the workflow from scratch, with a freshly configured and authorized bot for the Slack channel. This solved the issue of the blank template output.
-
To solve the repetitive initial test event output issue, I had to make adjustments from my initial Splunk SIEM alert settings.
The adjustments included switching the
Triggerfrom running once to running for each result, as well as adjusting the cron expression settings.Throttlewas also now enabled so repeat alerts wouldn't spam the channel, but every new alert would populate accordingly. The cron expression adjustment kept the flow of information consistent and digestible for analysts to leverage.A final adjustment was creating the eval portion to convert the
Time:section of the output from Epoch into a human-readable format.| eval _time=strftime(_time, "%Y-%m-%d %H:%M:%S" UTC)
In a production-grade environment, strict firewall rules should be constructed in such a way as to allow only one-way traffic as applicable, two-way when necessary. Employee account information and overall general Active Directory and Windows machine settings can be properly configured in accordance with STIG, CIS Benchmark, etc., guides to achieve the desired level of security hardening.
If telemetry is sensitive to the business, then a recommendation could be made to not utilize a free service such as Shuffle SOAR and instead retain the service of a proprietary software with an SLA that guarantees timely support services in the event of errors, new vulnerabilities, and/or patch application.
The Slack channel should be made private, only allowing the necessary personnel access to the data with read-only permissions, etc., to ensure the data retains its integrity and availability within the channel. The bot should also be strictly provisioned with the necessary role capabilities to complete its task.
Maintaining current configuration, the Windows VMs could be utilized to run Atomic Red Team testing, with telemetry captured and analyzed, then leveraged to create custom alerts and event triggers tailored to the information output by each test.
A Caldera server could also be leveraged in the same fashion for further Red Team emulation activities.
The Splunk SIEM environment could be better leveraged through the inclusion of dashboards and visualizations in accordance with any events, alerts, etc., that are of high interest to the analyst.
A more sophisticated workflow, or even multiple workflows, in Shuffle or an equivalent SOAR platform could be used to automate the enrichment of data using threat intelligence services such as VirusTotal, AbuseIPDB, etc., to build a highly informative and practical workflow.
Machines and endpoints can be added accordingly if necessary, along with relevant STIG application as part of a remediation effort for each testing phase.
This lab simulated a simplified Active Directory environment, with one designated Domain Controller and one joined host, along with a mock employee account. This environment was configured to forward telemetry to a Ubuntu Server instance hosting the Splunk Enterprise SIEM. This SIEM instance was then configured with a custom index and custom alert with a specific SPL query tailored for a specific use case. This Splunk alert was then bound to a Webhook in the Shuffle SOAR platform, which in turn forwarded the SIEM log information to a Slack node to format and output into a designated Slack channel for analysts to monitor and gain initial insight into the relevant events. This information could be used in many ways, and automation could be utilized further by automating the responses of analysts if repetitive tasks are present and procedure streamlining is possible.