An interactive Streamlit dashboard visualizing heterogeneous treatment effects of rain on NYC crash risk using H3 spatial indexing and causal inference.
Run it live: https://causalaccidents.streamlit.app/
This project analyzes how rain affects crash probability across different locations in NYC using:
- Geospatial Analysis: H3 hexagonal indexing (resolution 8, ~600m cells)
- Causal Inference: T-Learner with Gradient Boosting to estimate Conditional Average Treatment Effects (CATE)
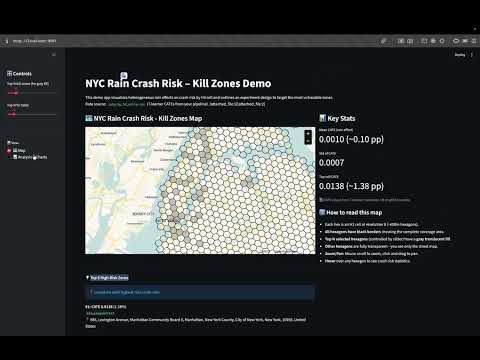
- Interactive Visualization: Flat Mercator map showing "kill zones" over NYC streets
For detailed information:
- Complete pipeline documentation →
documents/PIPELINE.md- Full analysis results & business insights →
documents/HETEROGENEITY_RESULTS.md
- Rain increases crash probability by 0.10pp on average (0.1013%)
- Effect varies 13.6x across locations (max 1.38pp in most vulnerable zones)
- High-traffic zones show 3x stronger rain sensitivity (18x higher traffic than average)
- Top vulnerable cell:
882a100d69fffff(885 Lexington Avenue, Upper East Side)
- Python 3.12+
cd CausalAccidents

# Create & activate virtual environment
python -m venv venv
source venv/bin/activate

# Install dependencies
pip install -r requirements.txt

# Start the app
streamlit run src/app.py
The app will open at http://localhost:8501
The dashboard has two main views accessible via sidebar:

Interactive NYC map with all 1,135 H3 hexagons
- Clean Visualization: All hexagons display with black borders over a street map
- Selective Highlighting: Top N highest-risk zones (adjustable 10-200) filled with translucent gray
- Google Maps-like Controls: Flat Mercator projection, scroll to zoom, drag to pan
- Hover Tooltips: See CATE, traffic, baseline risk, and crash count for any cell
- Top 5 Quick Reference: Geocoded addresses for the 5 most vulnerable zones
- Example: #1 - 885 Lexington Ave (CATE: 1.378%)

Comprehensive visual analytics with 4 key charts
- Shows how CATE is distributed across all 1,135 cells
- Red dashed line marks Top N cutoff
- Reveals highly-skewed distribution (justifies targeted interventions)
- Validates 3x traffic amplification effect
- Top 10 zones highlighted as red stars
- Color-coded by risk rank
- Detailed breakdown with geocoded addresses
- Ranks, CATE values, traffic, baseline risk
- Shows multiplier vs. average (e.g., 13.6x for top cell)
- Three-panel overview: Targeting, Geography, Impact
- Key metrics and percentiles
- Methodology notes
CausalAccidents/
├── data/
│   ├── cate_by_h3_cells.csv            # Main data (1,135 H3 cells)
│   ├── top_20_geocoded.csv             # Top 20 cells with street addresses
│   ├── nyc_crash_data.csv              # Raw crash data
│   ├── nyc_weather_hourly.csv          # Weather data
│   └── ...                             # Other pipeline outputs
│
├── documents/
│   ├── HETEROGENEITY_RESULTS.md        # Analysis results (must read)
│   └── PIPELINE_SUMMARY.md             # Full pipeline documentation (must read)
│
├── notebooks/
│   ├── 01_data_cleaning.ipynb          # Data cleaning and Feature Engineering (Collisions Data)
│   ├── 02_a_h3_construction.ipynb      # H3 initial construction
│   ├── 02_b_h3_full_construction.ipynb # H3 full panel construction (h3_cell, date, hour)
│   ├── 03_weather.ipynb                # Weather integration
│   ├── 04_causal.ipynb                 # Initial causal analysis
│   ├── 04.5_TLC_data_cleaning.ipynb    # Data cleaning and Feature Engineering (TLC Data)
│   ├── 05_causal_validation.ipynb      # Traffic-adjusted analysis
│   └── 06_CATE.ipynb                   # T-Learner CATE estimation
│
├── src/
│   ├── app.py                          # Main Streamlit dashboard (Map + Analysis views)
│   ├── geocode_top_20.py               # Geocoding script for top 20 H3 cells
│   └── test_map_visual.py              # Test map visualization
│
├── requirements.txt                    # Python dependencies
└── README.md                           # Project documentation
-
Crash Data Cleaning (
01_data_cleaning.ipynb)- NYPD Motor Vehicle Collisions (2022-01-01 to 2025-10-31)
- Parse timestamps, filter invalid lat/lon and geographic outliers
- Extract time features: day_of_week, is_weekend, month, is_rush_hour
- Output:
crashes_cleaned.csv(~92% retention rate)
-
Weather Data (
03_weather.ipynb)- Open-Meteo Historical Weather API (NYC coordinates)
- Hourly precipitation and visibility data
- Binary rain flag:
rain_flag = (precipitation > 0.1mm) - Output:
nyc_weather_hourly.csv(~33k hours, 8% rain prevalence)
-
Traffic Data (
04.5_TLC_data_cleaning.ipynb)- NYC TLC Trip Record Data (Yellow taxi pickups)
- Polyfill taxi zones to H3 cells with distributed allocation
- DuckDB optimization for 46 months of parquet files
- Output:
traffic_h3_2022_2025_polyfill.parquet(~1,500 cells)
-
Initial H3 Panel (
02_a_h3_construction.ipynb)- Apply H3 resolution 8 indexing to crashes (~600m hexagons)
- Aggregate to (h3_cell, date, hour) with crash counts
- Dense panel: cells with ≥1 historical crash
- Output:
h3_panel_res8.csv(~1,500 unique cells)
-
Full Panel Construction (
02_b_h3_full_construction.ipynb)- Cartesian product: H3_cells × Dates × Hours (avoid selection bias)
- Merge crash counts (fill zeros), weather, and compute Baseline_Risk
- Rolling 30-hour average crash rate per cell (lag-adjusted)
- Output:
h3_full_panel_res8.csv(~40M observations)
-
Causal Inference - Initial ATE (
04_causal.ipynb)- DoWhy framework with backdoor adjustment
- Propensity score weighting for average treatment effect
- Confounders: time features, Baseline_Risk, Traffic_Proxy
- Result: ATE ≈ 0.091pp, robustness checks passed
-
Causal Validation - Real Traffic (
05_causal_validation.ipynb)- Replace Traffic_Proxy with actual TLC traffic_count
- Re-estimate ATE with real exposure data
- Result: ATE ≈ 0.095pp (validates initial estimate)
-
Heterogeneous Effects (
06_CATE.ipynb)- T-Learner with GradientBoostingRegressor (100 trees, depth=5)
- Stratified sampling: 1M observations (500k rain / 500k no-rain)
- Features: log_traffic, Baseline_Risk, temporal covariates
- Training time: ~56 seconds, spatial aggregation to 1,135 cells
- Output:
cate_by_h3_cells.csv(mean, median, std per cell)
- Algorithm: T-Learner (two separate models for treatment/control)
- Base Learner: GradientBoostingRegressor (100 estimators, max_depth=5)
- Features: log_traffic, baseline_risk, day_of_week, is_weekend, month, is_rush_hour
- Training Time: ~56 seconds total
- Sample Size: 1M stratified sample
From HETEROGENEITY_RESULTS.md:
| Metric | Value |
|---|---|
| Mean CATE | 0.001013 (0.10pp) |
| Std CATE | 0.000732 |
| Max CATE | 0.013775 (1.38pp) |
| Total H3 Cells | 1,135 |
| High-traffic effect | 0.19pp (~3x average) |
| Low-traffic effect | 0.07pp |
- Target high-CATE zones (top 10%) with 2x surge pricing + safety alerts
- Sunday rain events: Pre-position drivers, proactive warnings (1.6x higher risk)
- Low-CATE zones: Standard operations (maintain competitiveness)
-
Geocoding integration (H3 → street addresses)DONE - Real-time CATE scoring API
- Historical back-testing dashboard
- Multi-city support (Chicago, LA, SF)
- Driver positioning optimization algorithm
- Live weather forecast integration
- A/B test deployment framework