
Diagnose vLLM server bottlenecks from live metrics.
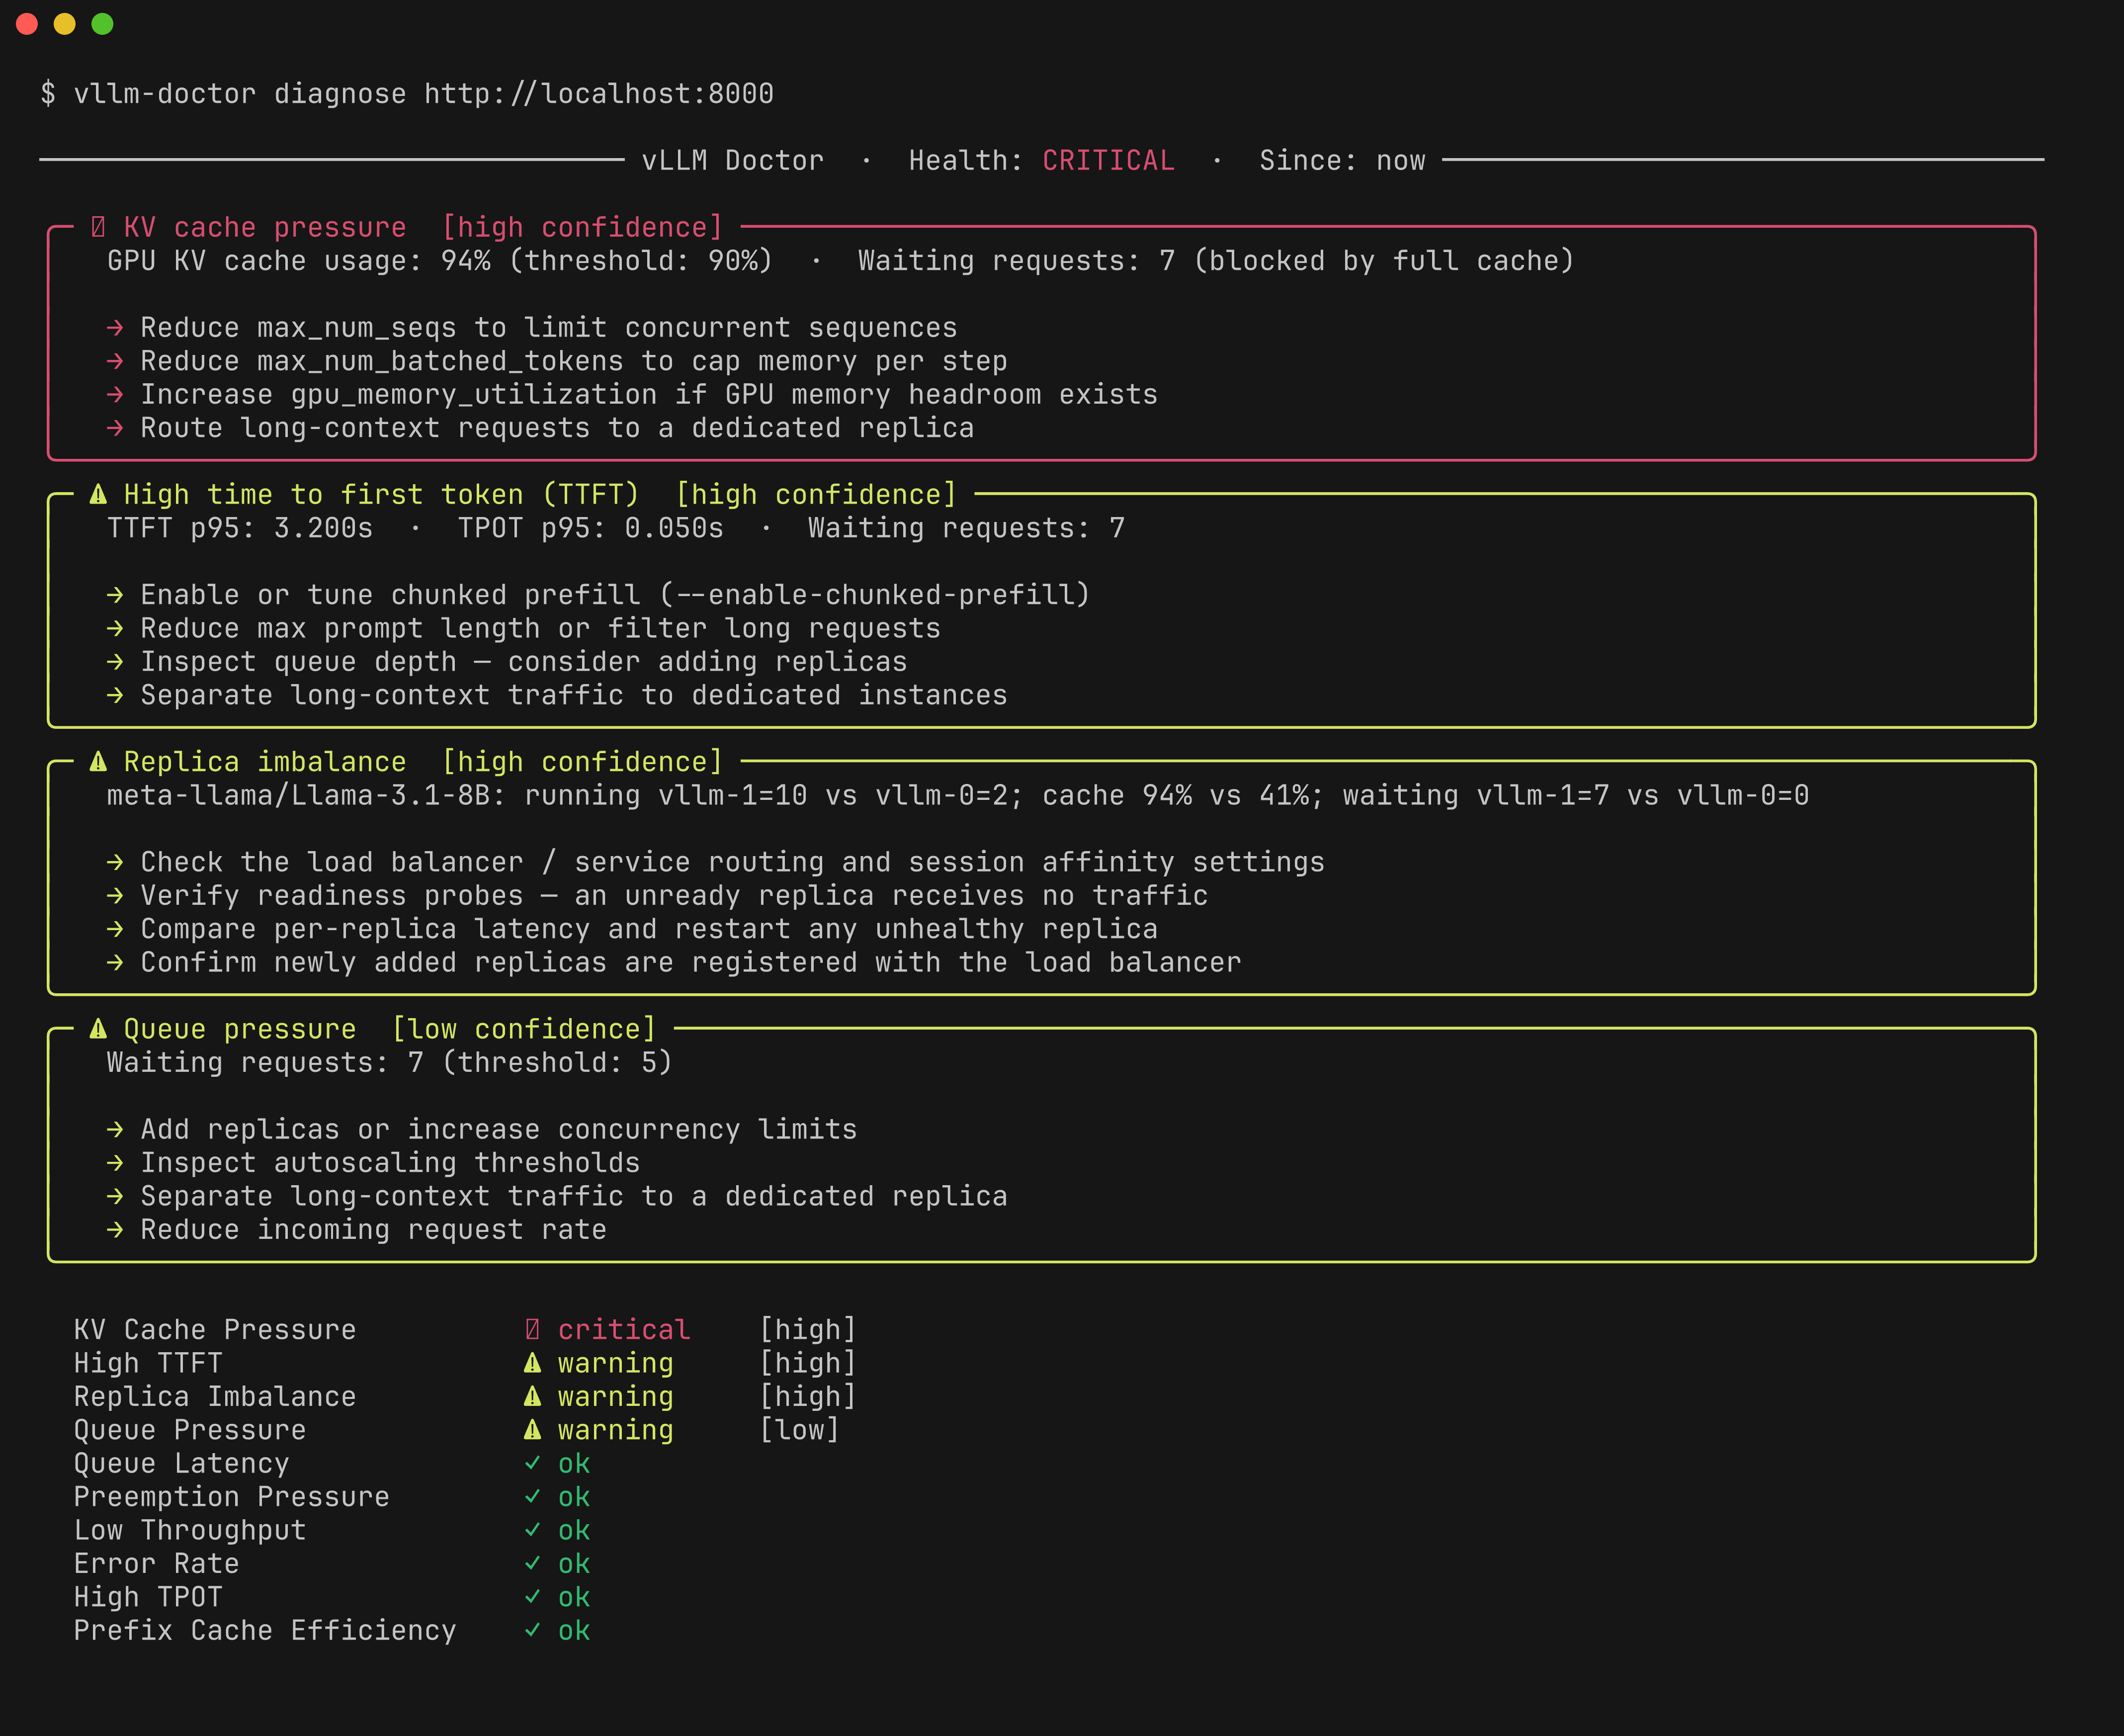
vLLM Doctor reads vLLM server metrics and turns them into diagnostic findings: what looks unhealthy, why it may be happening, and which vLLM settings are worth checking first.
vllm-doctor diagnose http://localhost:8000/metricsvLLM Doctor is not a dashboard replacement or benchmark runner. It is a fast server-side diagnostic snapshot for a single vLLM server or Prometheus target.
- Built-in diagnosis rules — queue pressure, TTFT/TPOT bottlenecks, KV cache pressure, low throughput, error rate, replica imbalance, prefix cache efficiency, preemption pressure, queue latency
- Local history — persist runs with
--save, review withhistory listandhistory show - Watch change-log —
--save --watchonly persists when state changes (health or firing rules) - Dual input — Prometheus or direct
/metricsscrape - Structured output — rich text tables or JSON for automation
- Configurable thresholds — per-rule tuning via TOML
Dashboards show metrics. vLLM Doctor explains server-side inference behavior.
| Dashboards | vLLM Doctor | |
|---|---|---|
| Shows raw metrics | ✓ | ✓ |
| Explains what's wrong | ✗ | ✓ |
| Recommends vLLM configs | ✗ | ✓ |
| Requires setup | ✓ | ✗ |
| Works on a single server | ✗ | ✓ |
GuideLLM is a good fit for generating workloads and measuring endpoint behavior. vLLM Doctor is a good fit for explaining server-side symptoms from vLLM metrics.
Used together, GuideLLM can create or replay load while vLLM Doctor helps explain bottlenecks such as queue pressure, KV cache pressure, high TTFT, or high TPOT.
Quick install (Linux & macOS):
curl -fsSL https://raw.githubusercontent.com/aminalaee/vllm-doctor/main/scripts/install.sh | shWith Cargo:
cargo install vllm-doctorWith Docker:
docker run --rm ghcr.io/aminalaee/vllm-doctor diagnose <url>Direct scrape:
vllm-doctor diagnose http://localhost:8000/metricsPrometheus:
vllm-doctor diagnose http://localhost:9090A prebuilt image is published to GitHub Container Registry:
docker run --rm ghcr.io/aminalaee/vllm-doctor diagnose <url><url> is your vLLM /metrics or Prometheus endpoint — the same argument the CLI takes — reachable from inside the container.
────────────────────────────────────────────────────────────────────────────────
                vLLM Doctor  ·  Health: CRITICAL  ·  Since: now
────────────────────────────────────────────────────────────────────────────────

╭──────────────────────────────────────────────────────────────────────────────╮
│                    ✖ KV cache pressure  [high confidence]                    │
│                                                                              │
│  GPU KV cache usage: 94% (threshold: 90%)  ·  Waiting requests: 7 (blocked   │
│  by full cache)                                                              │
│                                                                              │
│  → Reduce max_num_seqs to limit concurrent sequences                         │
│  → Reduce max_num_batched_tokens to cap memory per step                      │
│  → Increase gpu_memory_utilization if GPU memory headroom exists             │
│  → Route long-context requests to a dedicated replica                        │
╰──────────────────────────────────────────────────────────────────────────────╯
╭──────────────────────────────────────────────────────────────────────────────╮
│             ⚠ High time to first token (TTFT)  [high confidence]             │
│                                                                              │
│  TTFT p95: 3.200s  ·  TPOT p95: 0.050s  ·  Waiting requests: 7               │
│                                                                              │
│  → Enable or tune chunked prefill (--enable-chunked-prefill)                 │
│  → Reduce max prompt length or filter long requests                          │
│  → Inspect queue depth — consider adding replicas                            │
│  → Separate long-context traffic to dedicated instances                      │
╰──────────────────────────────────────────────────────────────────────────────╯
╭──────────────────────────────────────────────────────────────────────────────╮
│                    ⚠ Replica imbalance  [high confidence]                    │
│                                                                              │
│  meta-llama/Llama-3.1-8B: running vllm-1=10 vs vllm-0=2; cache 94% vs 41%;   │
│  waiting vllm-1=7 vs vllm-0=0                                                │
│                                                                              │
│  → Check the load balancer / service routing and session affinity settings   │
│  → Verify readiness probes — an unready replica receives no traffic          │
│  → Compare per-replica latency and restart any unhealthy replica             │
│  → Confirm newly added replicas are registered with the load balancer        │
╰──────────────────────────────────────────────────────────────────────────────╯
╭──────────────────────────────────────────────────────────────────────────────╮
│                      ⚠ Queue pressure  [low confidence]                      │
│                                                                              │
│  Waiting requests: 7 (threshold: 5)                                          │
│                                                                              │
│  → Add replicas or increase concurrency limits                               │
│  → Inspect autoscaling thresholds                                            │
│  → Separate long-context traffic to a dedicated replica                      │
│  → Reduce incoming request rate                                              │
╰──────────────────────────────────────────────────────────────────────────────╯

 KV Cache Pressure        ✖ critical  [high]
 High TTFT                ⚠ warning   [high]
 Replica Imbalance        ⚠ warning   [high]
 Queue Pressure           ⚠ warning   [low]
 Queue Latency            ✓ ok
 Preemption Pressure      ✓ ok
 Low Throughput           ✓ ok
 Error Rate               ✓ ok
 High TPOT                ✓ ok
 Prefix Cache Efficiency  ✓ ok

⚠ TTFT, TPOT and Queue Latency rules require Prometheus — connect to Prometheus for full analysis.

Observed Metrics:

 Metric                                    Value
 Requests Running                             12
 Requests Waiting                              7
 GPU Cache Usage        ███████████████████░ 94%
 Prefill Tokens/s                          390.0
 Decode Tokens/s                           252.0
 Requests Success                            114
 Requests Error                                0
 Requests Aborted                              0
 TTFT p95 (s)                              3.200
 TPOT p95 (s)                              0.050
 Queue Time p95 (s)                        0.800
 Preemptions Total                             0
 Prefix Cache Hit Rate                       50%

Observed Metrics per pod:

                    vllm-1  vllm-0
 Requests Running       10       2
 Requests Waiting        7       0
 GPU Cache Usage       94%     41%
 Prefill Tokens/s     80.0   310.0
 Decode Tokens/s      42.0   210.0
 Requests Success       30      84
 Requests Error          0       0
 Requests Aborted        0       0
Preemptions Total 0 0 Read the full documentation: https://aminalaee.github.io/vllm-doctor