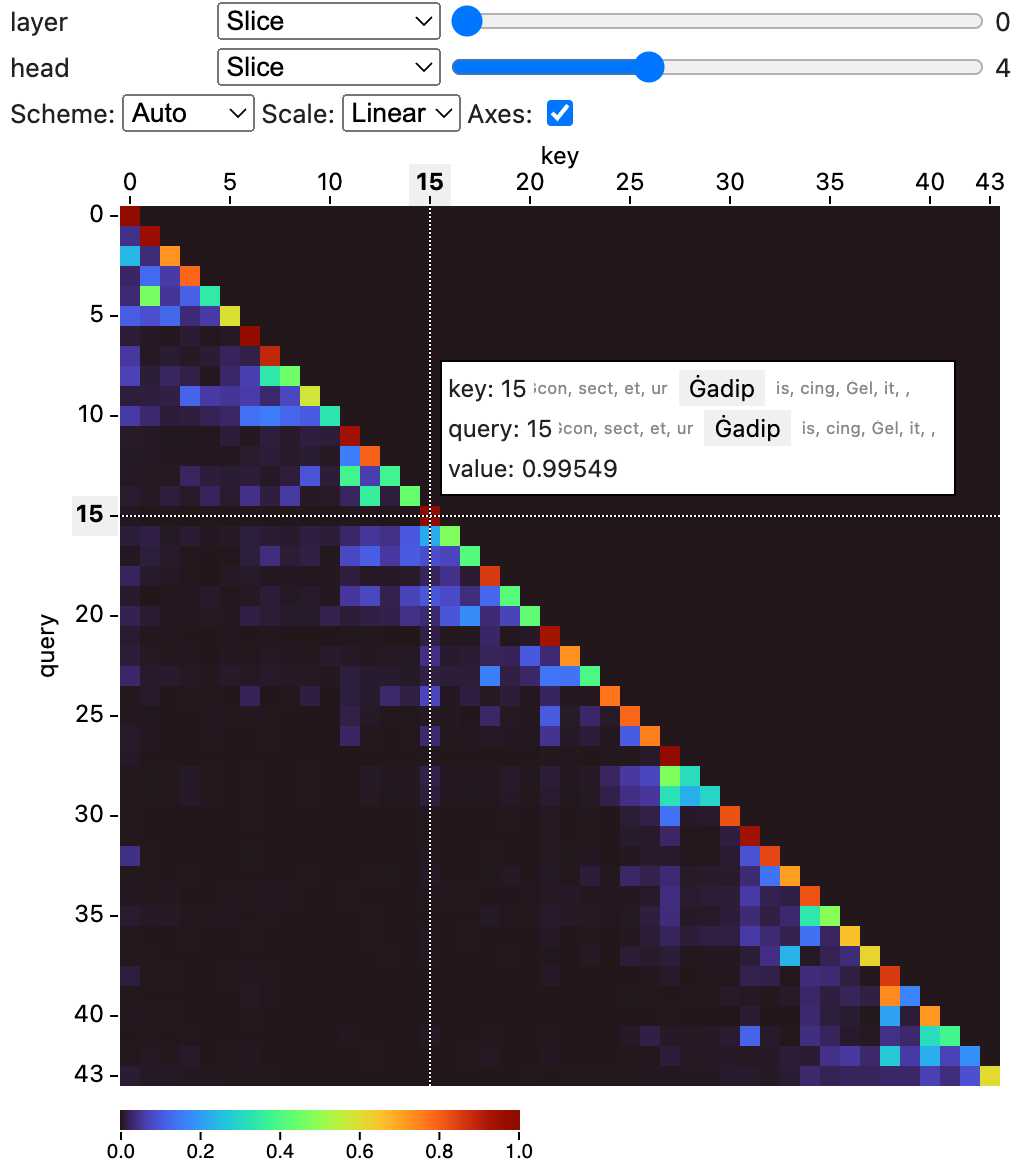
This is a package to visualize tensor data in notebooks.
Install the package from the Python Package Index (PyPI).
pip install tensor-visualizerYou can use this widget in a notebook to visualize tensor data.
The widget supports numpy ndarrays, PyTorch and Tensorflow tensors,
as well as MLX tensors.
from tensor_visualizer import TensorVisualizer

# Visualize a 4-dimensional numpy array.
import numpy as np
data = np.random.randn(5, 10, 10, 10)
widget = TensorVisualizer(data)
widget
from tensor_visualizer import TensorVisualizer
# Visualize a 4-dimensional torch tensor.
import torch
data = torch.randn((5, 10, 10, 10))
widget = TensorVisualizer(data)
widgetYou can name dimensions with the names argument:
TensorVisualizer(data, names=["batch", "channel", "height", "width"])and label indices for the dimensions with the labels argument:
TensorVisualizer(
    data,
    names=["batch", "channel", "height", "width"],
    labels=[["b1", "b2", "b3"], ["ch1", "ch2"]]
)
By default the widget infers the color scale automatically from your data. To configure the color scale, you can set the scale_domain, scale_type, and scale_scheme properties:
# Set the scale domain to [1, 100], log scale,
# and use the viridis color scheme.
w = TensorVisualizer(data, scale_domain=[1, 100], scale_type="log", scale_scheme="viridis")
# You can also set it after creating the widget
w.scale_domain = [0, 1]
If you are using inferred scales, you can access the inferred scale properties with current_scale_domain, current_scale_type, and current_scale_scheme. These properties are available only after the widget has been shown.
You may use the permute argument the re-order the tensor dimensions in the visualization. For instance, permute=[2, 0, 1, 3] shows dimension 2 first, then dimension 0, 1, and 3. The last two dimensions are used in the heatmap.
| Name | Description |
|---|---|
tensor |
The tensor to visualize. |
names |
The names for dimensions in the tensor. |
labels |
Lists of labels for dimensions in the tensor. |
default_views |
Specify the default views for each dimension, supported options are: slice, small-multiples, min, max, and mean. |
scale_domain |
Specify the scale domain. If unspecified, the widget will infer the domain automatically. |
scale_type |
Specify the scale type (linear or log). The default is linear. |
scale_scheme |
Specify the scale color scheme. If unspecified, the widget will infer the scheme automatically. |
permute |
Permute the order of the tensor's dimensions. |
This project consists of a Svelte library for the frontend component, and Python code for the widget.
To setup for frontend development, run:
npm install
npm run dev
You'll get a development server (usually at http://localhost:5173) that hosts an demo page of the frontend component.
To build the frontend package, run:
npm run buildTo build the Python package, run:
hatch buildTo develop the widget, you can start a Jupyter Lab instance and load the example notebooks in the examples folder:
hatch run jupyter lab