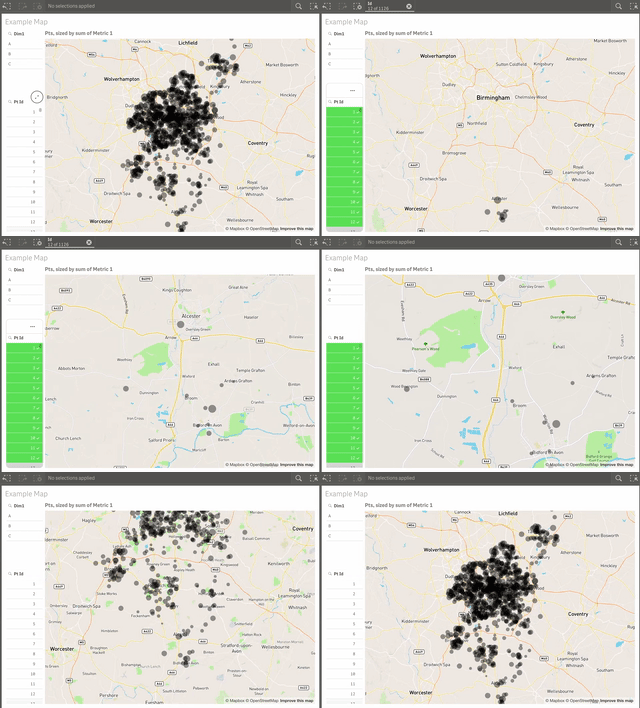
The MapboxGL extension is a small starter implementation of the Mapbox GL JS mapping library for Qlik Sense. Mapbox GL JS is a powerful web mapping tool that leverages vector tiles and WebGL to do client side rendering of highly performant and customizable maps.
This extension implements a point layer sized by a measure, allowing Qlik Sense users to load in their data points and plot them on a map as circles.
The following features can be customized from the properties panel:
- Mapbox Access Token - your API token that can be received for free from Mapbox
- Circle Color - the color of the circles rendered. Should be a hex color code
- Circle Opacity - the opacity of the circles
- Circle Size - the range of size from biggest to smallest circle based on the measure
- Map Style - the style of the background map rendered, based on map stylesheets provided by Mapbox
Note: this extension will NOT work in the Qlik Sense Desktop client, as QSD doesn't support WebGL. However, you can still use this extension with Qlik Sense Desktop if you do your development/usage through a web browser. Just open QSD, then navigate to "localhost:4848/hub" in a browser to use it there.
