Metric collection tool for level 3 and 4 packet analysis. Currently supports monitoring a network interface and displaying results as Prometheus metrics. Data collected:
- Source/Destination MAC addresses
- Source/Destination Ports
- Source/Destination IP addresses
- Layer 4 Protocol Used
- TCP Flag
- TLS Version
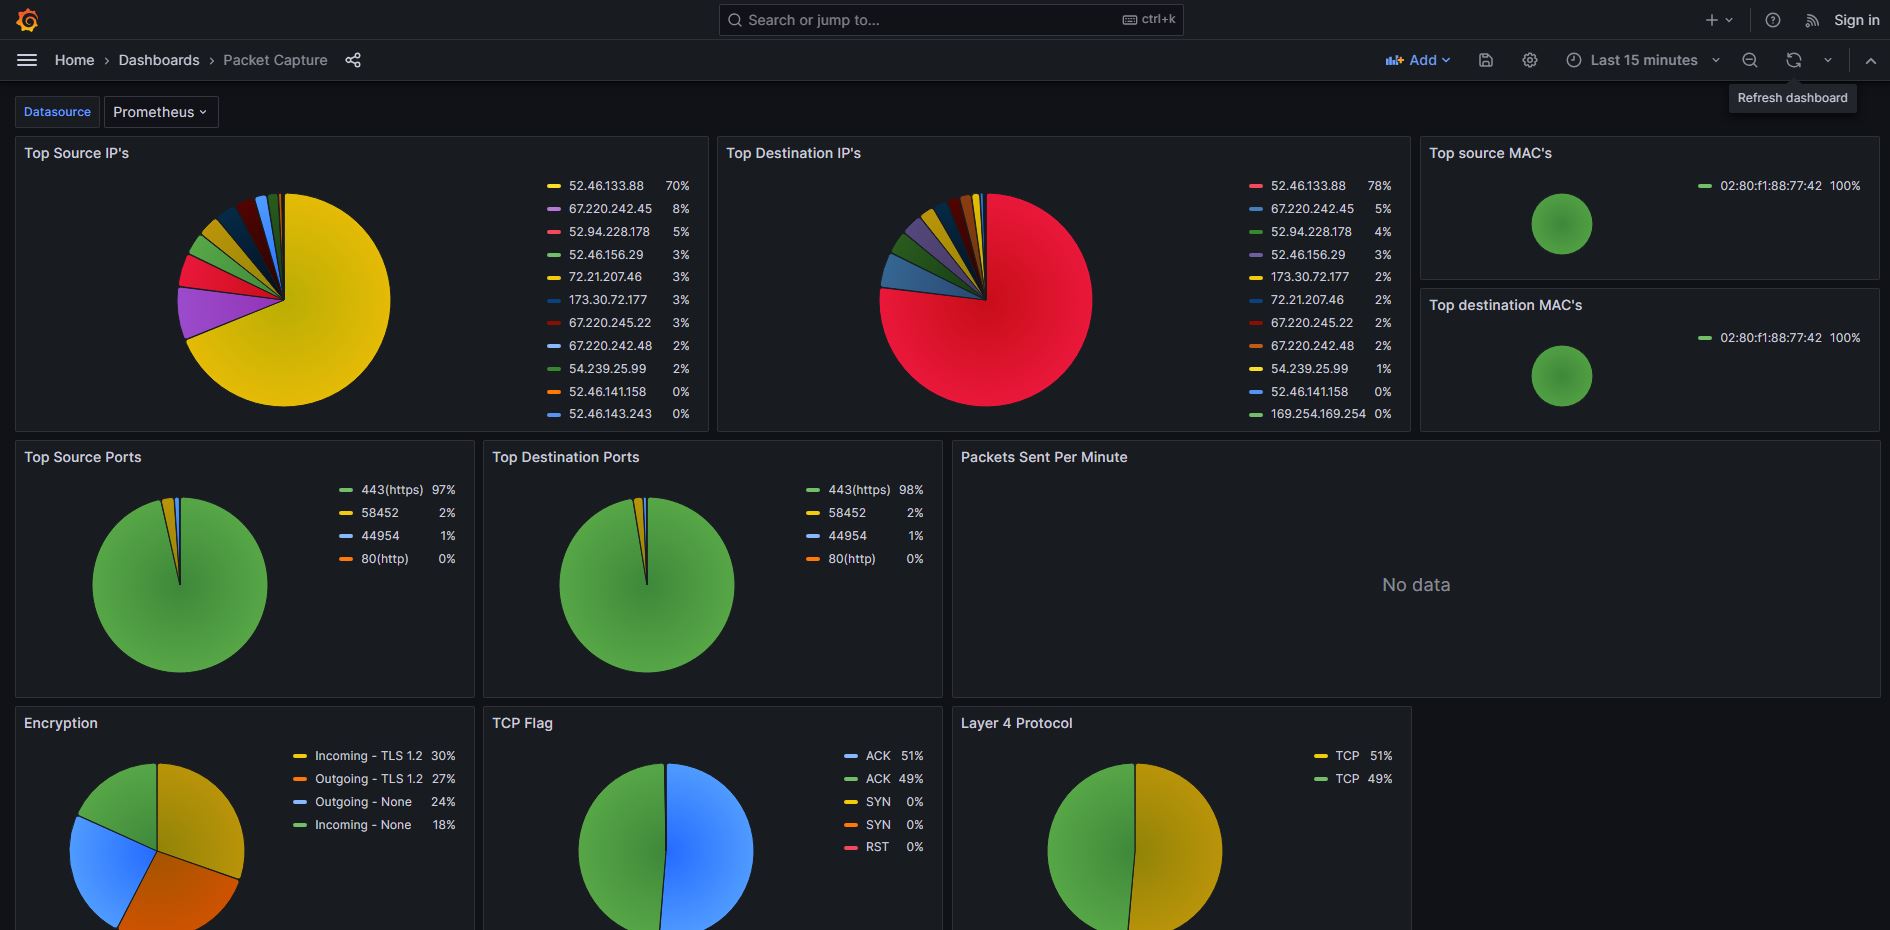
JSON for a basic Grafana dashboard built off Prometheus data from Sniffy can be found under /dashboards.
A binary for Sniffy can be obtained from the releases page. Sniffy has a dependency on PCAP libraries which vary by platform. Installation instructions for the most common platforms are below:
- Ubuntu/Debian -
apt-get install libpcap-dev - Alpine -
apk add libpcap-dev - CentOS/RHEL/Fedora -
dnf install libpcap-devel - Arch -
pacman -S libpcap - MacOS -
brew install libpcap - Windows - Npcap Install Instructions
You can then run the Sniffy binary to start capturing data, although you will likely need to create a config.yaml and pass it into Sniffy with the following flag: ./sniffy --config path/to/config.yaml. Details on the configuration are in the following section, with the most important detail being the name of the interface to monitor.
Once Sniffy is running, by default it'll open a Prometheus metrics page at localhost:8080/metrics where the data can be obtained. Prometheus remote write is a feature that I intend to add in the future.
The config is specified in yaml and the application by default looks for it in a configs folder within the current working directory, i.e. configs/config.yaml. You can override the path to the config with the command line flag --config=\path\to\config.yaml
For an example of the config file, look at config.yaml. Detailed configuration settings can be found listed below.
-
PCAP_INPUT- This encompasses settings surrounding the interface packets are being captured onINTERFACE_NAME- The interface name to capture packets on, as listed in a command such as ifconfigSNAP_LEN- SnapLen for pcap packet captureLOG_ALL_PACKETS- Boolean. Log whenever we see a packet. This will generate a significant number of logs and should only be used for debuggingFLUSH_AFTER- This setting currently has no effect on the application, but was implemented for use in future features. Connections which have buffered packets (they've gotten packets out of order and are waiting for old packets to fill the gaps) are flushed after they're this old (their oldest gap is skipped). Any string parsed by time.ParseDuration is acceptable hereLOCAL_MAC_ADDRESS- The MAC address to consider as being the local machine for incoming and outgoing packet counter metrics. If not specified, the application will attempt to determine the local MAC address itself
-
PROMETHEUS_OUTPUTENABLED- Enables the Prometheus metrics outputPROMETHEUS_EXPIRATION_INTERVAL- Specifies the interval in seconds on which the cleanup routine should run to expire stale data.PROMETHEUS_EXPIRE_AFTER- After how many seconds of not seeing a metric be updated should that metric be expired and no longer reported. This is a critical configuration for cardinality issues. Expire more frequently if cardinality becomes an issue in the exporter.PROMETHEUS_METRICS_PORT- Port to run the /metrics endpoint onPROMETHEUS_EXCLUDE_FIELDS- Array of fields to exclude in metrics to reduce cardinality. Options are:sourceMAC,destinationMAC,sourceIP,destinationIP,sourcePort,destinationPort,layer4Protocol,tcpFlag,tlsVersion
- Need to have Golang version 1.18+ installed
- You'll also likely need to install a package called libpcap-dev or libpcap-devel (depending on what package manager you're using) to handle a pcap.h error
- Running
go build -o sniffyfrom the root directory will build the binary.
- Prometheus remote write output
- Add counter for bytes incoming/outgoing, similar to packets counter