Nuclear Outage Monitor: Live Nuclear Plant Outage Data & Visualization is an MVC-based web application developed for the ISM6225 Application Development final project. The application retrieves and visualizes real-time nuclear power plant outage data from the U.S. Energy Information Administration (EIA).
The primary goal of this project is to demonstrate Team 4’s proficiency in C#/.NET MVC architecture, API integration, and JavaScript-based data visualization, while delivering a functional, user-friendly interface for exploring outage trends and capacity impacts across U.S. nuclear facilities.
URL to Site: https://appdevgroup4-c2evc9avbnfvc6d0.eastus2-01.azurewebsites.net/
- Live Data Integration
- Pulls daily nuclear outage data directly from the EIA public API
- Displays outage capacity, outage amount, and percentage outage metrics
- Automatically retrieves the most recent records using server-side API calls
- Interactive Data Visualization
- JavaScript-powered charts to visualize outage trends over time
- Dynamically updates based on API responses
- Designed to support rapid interpretation of operational impact
- Full CRUD Functionality
- Users can create, read, update, and delete outage records
- Structured workflow with confirmation steps to prevent accidental data loss
- MVC Architecture
- Clear separation of concerns across Models, Views, and Controllers
- Service-based API access for maintainability and scalability
API Endpoint
- Base URL: https://api.eia.gov/v2/
- Resource Path:
nuclear-outages/generator-nuclear-outages/data/
frequency=daily
data[0]=capacity
data[1]=outage
data[2]=percentOutage
sort[0][column]=period
sort[0][direction]=desc
offset=0
length=5000
api_key=YOUR_API_KEY
- Base URL: Entry point for all EIA data services
- API Key: Required for authentication (users must generate their own via EIA)
- EIA (Energy Information Administration): A U.S. federal agency responsible for collecting and publishing energy data to support policy decisions, market efficiency, and public understanding
Updated ERD Diagram
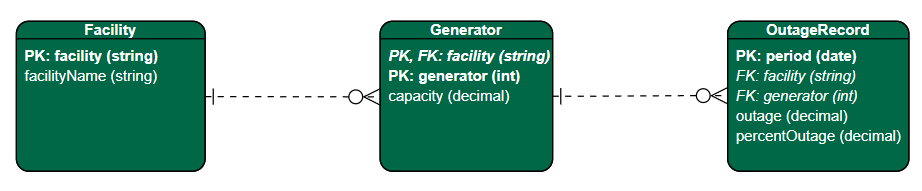
The data model was refined to support outage metrics, timestamps, and plant-level attributes while ensuring relational consistency across entities.
The CRUD workflow was inspired by design conventions observed in the data.gov repository, with a focus on clarity and usability.
- Read: Displays all outage records in a structured, scrollable layout for easy review.
- Create: A dedicated Create page allows users to enter and submit new outage records via a form interface.
- Update: Each record includes an Edit button that opens a pre-populated form, allowing users to modify existing data.
- Delete: The Delete action routes users to a confirmation page to ensure intentional removal of records.
- Singleton Service Configuration
- Challenge: Properly configuring a shared service for API access
- Solution: Registering the service as a singleton in Program.cs:
builder.Services.AddSingleton<NuclearOutageService>();This ensured efficient reuse of API resources and consistent data access across controllers.
- Data Visualization Issues
- Challenge: Initial chart failures caused by incorrect API data handling
- Solution: Refinement of API query parameters and response parsing, as outlined in the API section above
- “About Us” Page Layout & Symmetry
- Challenge: Maintaining consistent alignment and spacing across varying team member content
- Solution:
- Leveraged GitHub Copilot within Visual Studio to explore layout best practices
- Applied
margin-bottomstyling to role-related CSS classes for horizontal symmetry - Implemented a flexible
member-infolayout with dynamic spacing andmargin-topadjustments for contribution lists
This approach ensured visual consistency despite differences in content length.
-
Alvaro Montoya Ruiz (Frontend Developer / Managerial) Led front-end development efforts and supported project management coordination. Assigned and tracked tasks using JIRA, developed the About Us page, and implemented dynamic CRUD page functionality. Improved overall user experience through targeted UI refinements and styling updates. Conducted deployment testing and quality assurance to ensure application stability and correctness. Contributed extensively to layout structure and shared CSS resources.
-
Mauricio Bermudez (Full-Stack Developer / Managerial) Designed and implemented the data visualization layer using Chart.js, integrating live nuclear outage data from the EIA API. Built MVC controllers and managed database logic to support application functionality. Assisted with task assignment and tracking through JIRA. Performed post-deployment testing and quality assurance to validate data accuracy and application reliability. Contributed to visualization components, layout structure, and shared CSS files.
-
Marta Falceto (Frontend Developer / Content Creator) Developed the application’s Home page and CRUD pages, ensuring consistency and usability across views. Created content and supporting materials for the group project presentation. Enhanced the user interface through iterative design refinements and styling improvements. Participated in deployment testing and quality assurance efforts. Contributed to Home and CRUD views, layout templates, and shared CSS resources.
-
Ryan Stopczynski (Data Integration Engineer) Designed the logical data model and led API integration efforts, fetching and processing live data from external sources. Implemented a singleton database pattern and utilized Data Transfer Objects (DTOs) to improve data flow efficiency. Conducted deployment testing and quality assurance to validate system performance and correctness. Contributed to Home views, layout structure, and shared CSS files.
- Backend:
- C#
- ASP.NET MVC
- Frontend:
- JavaScript
- HTML / CSS
- Data & APIs:
- EIA Public API
- Development Tools:
- Visual Studio
- GitHub
- GitHub Copilot
- Expand visualization options to support filtering by plant or region
- Add pagination or lazy loading for large outage datasets
- Improve UI responsiveness for mobile and tablet devices
- Implement caching to reduce redundant API calls