How to use the framework
Content:
- Definitions
- Way of working
-
Examples
- Which data source are covering the most techniques?
- Add data sources and score data quality
- Map data sources
- Score visibility
- Visibility coverage
- Auto-update visibility scores and the use of the
score_logbook - Score detection and determine your detection coverage
- Threat actor group heat map
- Compare group or red team exercise with detection/visibility coverage
- Compare visibility and detection coverage
- Automation
The terms data source, visibility and detection are used extensively within DeTT&CT. Therefore it is essential to understand the meaning and the difference between those terms.
Data sources are the raw logs or events generated by systems, security appliances, network devices, etc. ATT&CK has over 30 different data sources, which are further divided into over 90 data components. All of the data components are included in this framework. These data sources are administrated within the data source administration YAML file and for each data source, among others, the data quality can be scored. Within ATT&CK these data sources are listed within the techniques themselves (e.g. T1003 in the Detection section).
Visibility is used within DeTT&CT to indicate if you have sufficient data sources with sufficient quality available to be able to see traces of ATT&CK techniques. Visibility is necessary to perform incident response, execute hunting investigations and build detections. Within DeTT&CT you can score the visibility coverage per ATT&CK technique. More on how and why is explained here. The visibility scores are administrated in the technique administration YAML file.
When you have the right data sources with sufficient data quality and available to you for data analytics, your visibility can be used to create new detections for ATT&CK techniques. Detections often trigger alerts and are hence followed up on by your blue team. Scoring and administrating your detections is done in the technique administration YAML file.
For layers files created by DeTT&CT, we recommend using this URL to the Navigator as it will make sure metadata in the layer file does not have a yellow underline: https://mitre-attack.github.io/attack-navigator/#comment_underline=false&metadata_underline=false
Within both the technique administration and in the data source administration file (as of version 1.1) you can specify the type of system(s) (e.g. Windows endpoints, Linux servers, Crown jewel X, etc.) a detection, visibility or data source score apply to (including the other administrated properties).
You can choose between two approaches. A single YAML technique and data source administration file, in which you record scores and properties for all of the types of Systems you have. Or a dedicated technique and data source YAML administration file per type of System. Remember that the latter approach (based on your IT environment specifics) will result in administrative overhead. Such as when a detection or data source applies to more than one type of System.
On a file-based level this looks like this:
- Single YAML file approach
  technique_administration.yaml
  data_source_administration.yaml
- Multi YAML file approach
  technique_administration_Windows-workstations.yaml
  data_source_administration_Windows-workstations.yaml

  technique_administration_Linux-servers.yaml
  data_source_administration_Linux-servers.yaml
This capability reduces the administrative overhead when dealing with overlap on what (i.e. detection, visibility, data source) you have per type of System. In addition, calculating a visibility score based on your data source administration file stays accurate when having multiple Systems and hence numerous platforms within the same data source administration file. The reason is that within a data source administration file, a System does not only have a name (i.e. its applicable_to value), but also for that System the relevant ATT&CK platform(s).
See below an example Systems specification from a data source administration, showing two Systems linked to two different platforms:
systems:
- applicable_to: Windows workstations
  platform:
  - Windows
- applicable_to: Linux servers
  platform:
- LinuxIt is highly recommended to match the used Systems/applicable to values, between your technique and data source administration file. This will then allow you to automatically update your visibility scores within your technique administration file, based on changes made within your data source administration file. More on that topic can be found here.
Below are some examples to further explain how to use the framework. You can also check one of these resources:
- Our talk at hack.lu 2019.
- Blog: mbsecure.nl/blog/2019/5/dettact-mapping-your-blue-team-to-mitre-attack or
- Blog: siriussecurity.nl/blog/2019/5/8/mapping-your-blue-team-to-mitre-attack.
- The video from Justin Henderson on data source visibility and mapping.
Two general comments we would like to make:
- Use the tool in the way it works best for you. For example, mapping and scoring every single technique within the ATT&CK Matrix can be a lot of work. Therefore you may only score what you know at that time and what you want to communicate with others or want to verify/compare.
- It is recommended to periodically have a good look at your data source and techniques administration to see if anything has changed during the recent time, and therefore need to be updated. It can be helpful to draw up a checklist for this, which you can then repeated after X time has passed.
Using the command python dettect.py generic -ds, you can determine which data sources within ATT&CK cover the most techniques. This can, for example, be useful to guide you in identifying which data sources will provide you with a lot of visibility and are hence a good candidate to have available in a SIEM (like) solution.
Count  Data Source                              Platform(s)
------------------------------------------------------------------------------------------------------------------------
255    Command Execution                        Containers, Linux, Network, Windows, macOS
206    Process Creation                         Linux, Windows, macOS
98     File Modification                        Linux, Network, Windows, macOS
88     File Creation                            Linux, Network, Windows, macOS
82     Network Traffic Flow                     IaaS, Linux, Windows, macOS
78     OS API Execution                         Linux, Windows, macOS
70     Network Traffic Content                  IaaS, Linux, Windows, macOS
58     Windows Registry Key Modification        Windows
58     Network Connection Creation              IaaS, Linux, Windows, macOS
55     Application Log Content                  Google Workspace, IaaS, Linux, Office 365, SaaS, Windows, macOS
50     Module Load                              Linux, Windows, macOS
46     File Access                              Linux, Network, Windows, macOS
46     Web [DeTT&CT data source]                Windows, macOS, Linux, IaaS, Office 365, Google Workspace, SaaS,
                                                Network, Containers
37     File Metadata                            Linux, Network, Windows, macOS
32     Logon Session Creation                   Azure AD, Google Workspace, IaaS, Linux, Office 365, SaaS, Windows,
                                                macOS
26     Script Execution                         Windows
22     Response Content                         PRE
21     Internal DNS [DeTT&CT data source]       Windows, macOS, Linux, IaaS, Network, Containers
20     User Account Authentication              Azure AD, Containers, Google Workspace, IaaS, Linux, Office 365, SaaS,
                                                Windows, macOS
18     Process Access                           Linux, Windows, macOS
17     Windows Registry Key Creation            Windows
17     Email [DeTT&CT data source]              Windows, macOS, Linux, Office 365, Google Workspace, SaaS
15     Service Creation                         Linux, Windows, macOS
15     Host Status                              Linux, Windows, macOS
13     Active Directory Object Modification     Azure AD, Windows
12     Service Metadata                         Linux, Windows, macOS
11     Process Metadata                         Linux, Windows, macOS
10     Driver Load                              Linux, Windows, macOS
10     File Deletion                            Linux, Network, Windows, macOS
9      Firmware Modification                    Linux, Windows, macOS
9      Logon Session Metadata                   Azure AD, Google Workspace, IaaS, Linux, Office 365, SaaS, Windows,
                                                macOS
9      Process Modification                     Linux, Windows, macOS
8      User Account Metadata                    Azure AD, Containers, Google Workspace, IaaS, Linux, Office 365, SaaS,
                                                Windows, macOS
7      Windows Registry Key Access              Windows
7      Scheduled Job Creation                   Containers, Linux, Windows, macOS
7      Malware Metadata                         PRE
7      Active Directory Credential Request      Azure AD, Windows
6      Container Creation                       Containers
6      Web Credential Usage                     Azure AD, Google Workspace, Linux, Office 365, SaaS, Windows, macOS
6      Response Metadata                        PRE
6      User Account Creation                    Azure AD, Containers, Google Workspace, IaaS, Linux, Office 365, SaaS,
                                                Windows, macOS
6      Drive Modification                       Linux, Windows, macOS
6      User Account Modification                Azure AD, Containers, Google Workspace, IaaS, Linux, Office 365, SaaS,
                                                Windows, macOS
5      Instance Creation                        IaaS
5      Active DNS                               PRE
5      Passive DNS                              PRE
5      Network Share Access                     Linux, Windows, macOS
5      Drive Access                             Linux, Windows, macOS
5      Service Modification                     Linux, Windows, macOS
4      Image Creation                           IaaS
4      Instance Start                           IaaS
4      Active Directory Object Creation         Azure AD, Windows
4      Malware Content                          PRE
4      Social Media                             PRE
4      Domain Registration                      PRE
4      Drive Creation                           Linux, Windows, macOS
4      Windows Registry Key Deletion            Windows
3      Active Directory Object Access           Azure AD, Windows
3      Instance Metadata                        IaaS
3      Container Start                          Containers
3      Web Credential Creation                  Azure AD, Google Workspace, Linux, Office 365, SaaS, Windows, macOS
3      Firewall Rule Modification               Azure AD, Google Workspace, IaaS, Linux, Office 365, SaaS, Windows,
                                                macOS
3      Firewall Disable                         Azure AD, Google Workspace, IaaS, Linux, Office 365, SaaS, Windows,
                                                macOS
3      Instance Deletion                        IaaS
3      Snapshot Creation                        IaaS
3      Process Termination                      Linux, Windows, macOS
2      Cloud Storage Enumeration                IaaS
2      Cloud Storage Access                     IaaS
2      Pod Metadata                             Containers
2      Active Directory Object Deletion         Azure AD, Windows
2      Cloud Service Modification               Azure AD, Google Workspace, IaaS, Office 365, SaaS
2      Cloud Service Disable                    Azure AD, Google Workspace, IaaS, Office 365, SaaS
2      Certificate Registration                 PRE
2      Cloud Storage Metadata                   IaaS
2      Instance Modification                    IaaS
2      Instance Stop                            IaaS
2      Firewall Metadata                        Azure AD, Google Workspace, IaaS, Linux, Office 365, SaaS, Windows,
                                                macOS
2      Firewall Enumeration                     Azure AD, Google Workspace, IaaS, Linux, Office 365, SaaS, Windows,
                                                macOS
2      Group Enumeration                        Azure AD, Google Workspace, IaaS, Office 365, SaaS, Windows
2      Group Metadata                           Azure AD, Google Workspace, IaaS, Office 365, SaaS, Windows
2      Image Metadata                           IaaS
2      Scheduled Job Metadata                   Containers, Linux, Windows, macOS
2      Scheduled Job Modification               Containers, Linux, Windows, macOS
2      Kernel Module Load                       Linux, macOS
2      WMI Creation                             Windows
2      Group Modification                       Azure AD, Google Workspace, IaaS, Office 365, SaaS, Windows
2      Driver Metadata                          Linux, Windows, macOS
2      Snapshot Modification                    IaaS
2      Snapshot Deletion                        IaaS
2      Volume Deletion                          IaaS, Linux, Windows, macOS
2      Cloud Storage Modification               IaaS
2      Cloud Service Enumeration                Azure AD, Google Workspace, IaaS, Office 365, SaaS
1      Cluster Metadata                         Containers
1      Container Enumeration                    Containers
1      Container Metadata                       Containers
1      Pod Enumeration                          Containers
1      Pod Creation                             Containers
1      Pod Modification                         Containers
1      Instance Enumeration                     IaaS
1      Snapshot Metadata                        IaaS
1      Snapshot Enumeration                     IaaS
1      Volume Metadata                          IaaS, Linux, Windows, macOS
1      Volume Enumeration                       IaaS, Linux, Windows, macOS
1      Named Pipe Metadata                      Linux, Windows, macOS
1      User Account Deletion                    Azure AD, Containers, Google Workspace, IaaS, Linux, Office 365, SaaS,
                                                Windows, macOS
1      Image Modification                       IaaS
1      Volume Creation                          IaaS, Linux, Windows, macOS
1      Volume Modification                      IaaS, Linux, Windows, macOS
1      Cloud Storage Creation                   IaaS
1      Cloud Service Metadata                   Azure AD, Google Workspace, IaaS, Office 365, SaaS
1      Image Deletion                           IaaS
1      Cloud Storage Deletion                   IaaS
1      DHCP [DeTT&CT data source]               Windows, macOS, Linux
Depending on the company's needs, you could start with administrating data sources and scoring the quality within a data source YAML file. In other words, you could also first start with mapping and scoring your detection.
An example data source administration YAML file can be found here. Dot not forget to take into account which data sources are applicable per platform as described on this page.
Filling in your data sources and scoring them will, later on, be very useful in scoring visibility. More on scoring data quality can be found here: Data sources.
Based on the YAML file you can generate an Excel sheet containing all your data sources, properties, notes and data quality scores:
python dettect.py ds -fd sample-data/data-sources-endpoints.yaml -e

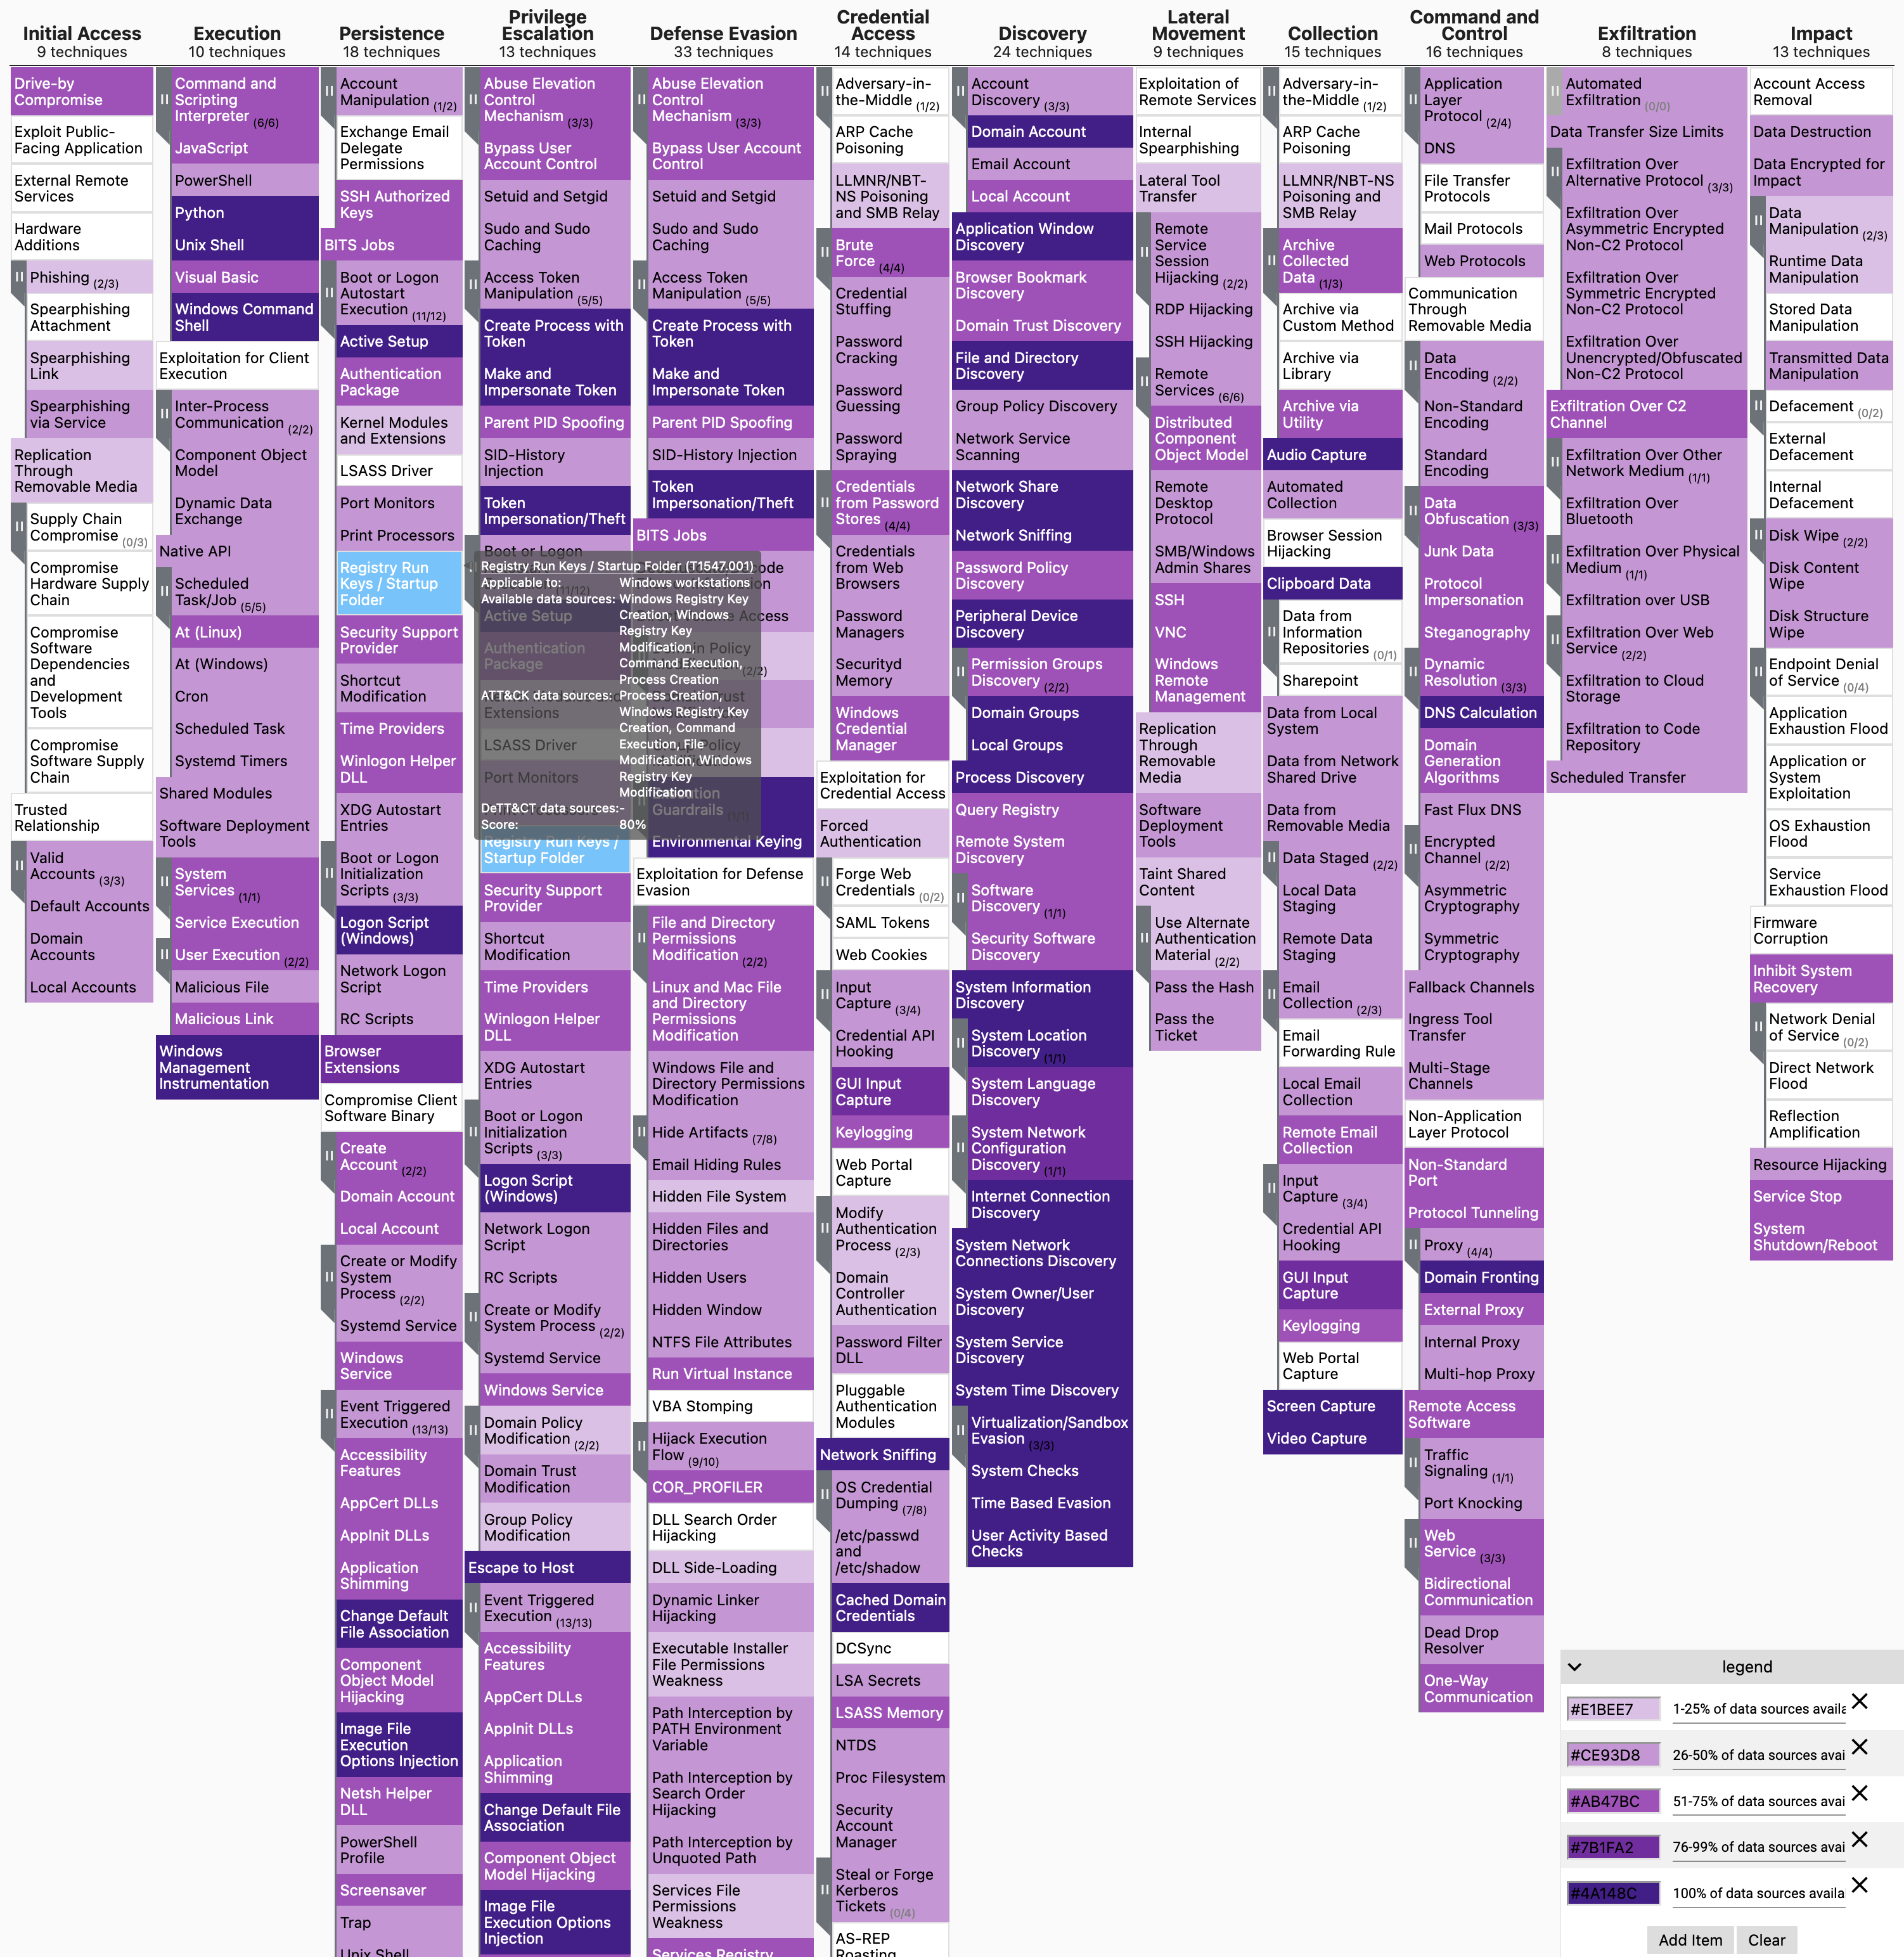
Generate an ATT&CK Navigator layer file based on data sources recorded in the YAML file. Based on the amount of data sources, techniques are mapped and visualised in the layer file. This gives you a rough overview of your visibility coverage. Often, this is the first step in getting an overview of your actual visibility coverage.
python dettect.py ds -fd sample-data/data-sources-endpoints.yaml -l
The next step can be to determine the exact visibility per technique, for which we do not recommend doing this for every technique but do it on a case by case basis. To help you with this, you can generate a techniques administration YAML file based on your data source administration, which will provide you with rough visibility scores. By default the argument --yaml will only include techniques in the resulting YAML for which the visibility score is greater than 0. To include all ATT&CK techniques that apply to the platform(s) specified in the data source YAML file, add the argument: --yaml-all-techniques.
python dettect.py ds -fd sample-data/data-sources-endpoints.yaml --yaml
Within the resulting YAML file, you can choose to adjust the visibility score per technique based on expert knowledge and the previously defined quality of your data sources (in this same YAML file you can also score detection). There are several reasons why manual scoring can be required. For example:
- You may have 1 data source available from the total 3 data sources mentioned within a particular ATT&CK technique. However, in some cases that single data source could not be sufficient for at least a minimum detection level for that technique. And hence, the visibility score based on the number of data sources needs to be adjusted.
- The quality of a particular data source is considered too low to be useful for visibility.
- With the power of an EQL query, you can influence which data sources are included in the process of auto-generating visibility scores. For example, to exclude data sources with low data quality. For more info see: Customize the rough visibility score.
- You do have a certain level of visibility on a technique. But this is based on a data source currently not mentioned within MITRE ATT&CK for that particular technique.
Visibility scores are rated from 0 to 4. You can find the explanation of the scores here: visibility scores. Use the score that fits best. It is possible to have multiple scores per technique that apply to different systems using the applicable_to property. (Please note that within the same technique, a system can only be part of one applicable_to key-value pair). In addition, you can keep track of changes in the scores by having multiple score objects within a score_logbook
Generate an ATT&CK Navigator layer file based on the technique administration in the YAML file. The visibility scores defined in the YAML file are also used to colour the techniques in the layer file. This gives you an overview of your visibility coverage:
python dettect.py v -ft sample-data/techniques-administration-endpoints.yaml -l

The below is purely hypothetical to explain the effect of adding a data source to your data source administration file and the concept of the score_logbook. Please also have a look at this section to make sure the name of the System/applicable to, between your technique and data source administration file, match.
Because we added the data source "Internal DNS", on 2021-09-22 within the data source administration file, we gained more visibility. We can then choose to automatically update our rough visibility scores in our technique administration YAML file using the comment below. Note that manually assigned visibility scores will not be overwritten without your approval, and backups are created. Among others, there is also an option to compare every visibility score eligible for an update and then approve or reject the update.
python dettect.py ds -ft sample-data/techniques-administration-endpoints.yaml -fd sample-data/data-sources-endpoints.yaml --update
When we, after the update, have a look at the ATT&CK technique T1071.004/DNS in the sample technique administration file, we can see that we now have visibility recorded in the score_logbook. Or for example, in T1572/Protocol Tunneling the rough visibility score increased from 1 to level 2.
Also, this new visibility for T1071.004/DNS allowed us (again hypothetical) to develop a detection. This change is also recorded in score_logbook object. See below:
- technique_id: T1071.004
  technique_name: DNS
  detection:
    applicable_to:
    - all
    location:
    - Splunk use case X8
    comment: ''
    score_logbook:
    - date: 2021-10-06T00:00:00Z
      score: 4
      comment: Could be implemented thanks to the Internal DNS data source now being
        present in Splunk
  visibility:
  - applicable_to:
    - all
    comment: ''
    score_logbook:
    - date: 2021-09-22
      score: 2
      comment: Connected the Internal DNS DeTT&CT data source to Splunk
      auto_generated: true
Another use-case for the auto-update is when MITRE ATT&CK introduced new techniques, makes changes in the data source listed for a technique or introduces new data sources.
Determen your detection score per technique in the technique administration YAML file. This is a manual exercise. Detection scores are rated from -1 to 5. The explanation of the scores can be found here: detection scores. Use the score that fits best. It is possible to have multiple scores per technique that apply to different systems using the applicable_to property. (Please note that within the same technique, a system can only be part of one applicable_to key-value pair). In addition, you can keep track of changes in the scores by having multiple score objects within a score_logbook
A next step can be to generate an ATT&CK Navigator layer file based on your scores you have determined per technique in the YAML administration file. The detection scores in the YAML file are also used to colour the techniques in the layer file. This gives you an overview of your detection coverage:
python dettect.py d -ft sample-data/techniques-administration-endpoints.yaml -l

Generate an ATT&CK Navigator layer file based on threat actor group data in ATT&CK. Or your threat actor data stored in a group YAML file.
The below-generated layer file contains a heat map based on all threat actor data within ATT&CK. The darker the colour in the heat map, the more often the technique is being used among groups. Please note that, like all data, there is bias. As very well explained by MITRE: Building an ATT&CK Sightings Ecosystem.
python dettect.py g

It is also possible to create a heat map based on a subset of groups present in ATT&CK:
python dettect.py g -g 'fin7' -g 'cobalt group'
Or based on threat actor data you store in a YAML group administration file:
python dettect.py g -g sample-data/groups.yaml

Read the help for group on all available functionality. Including how you can compare threat actor groups: python dettect.py g -h
You can compare a group YAML file with, for example, data on a red team exercise or a specific threat actor group with your detection or visibility. DeTT&CT can generate an ATT&CK Navigator layer file in which the differences are visually shown with a legend explaining the colours.
python dettect.py g -g sample-data/groups.yaml -o sample-data/techniques-administration-endpoints.yaml -t detection

It is possible to compare your visibility and detection coverage in one ATT&CK Navigator layer file. This will give you insight into where you have visibility, detection and both.
python dettect.py d -ft sample-data/techniques-administration-endpoints.yaml -o

# or:

python dettect.py v -ft sample-data/techniques-administration-endpoints.yaml -o
To include DeTT&CT within your automation solution, you can use Dettectinator. It can be included as a Python library (pip install dettectinator) or it can be used via the command line (python dettectinator.py -h).
Dettectinator provides plugins to read detections from your SIEM or EDR and create/update the DeTT&CT YAML file, so that you can use it to visualize your ATT&CK detection coverage in the ATT&CK Navigator.
More information can be found on Github: Dettectinator.