Where the internet thinks you are – and how directly you actually reach it.


curl -fsSL https://geocheck.ing | sh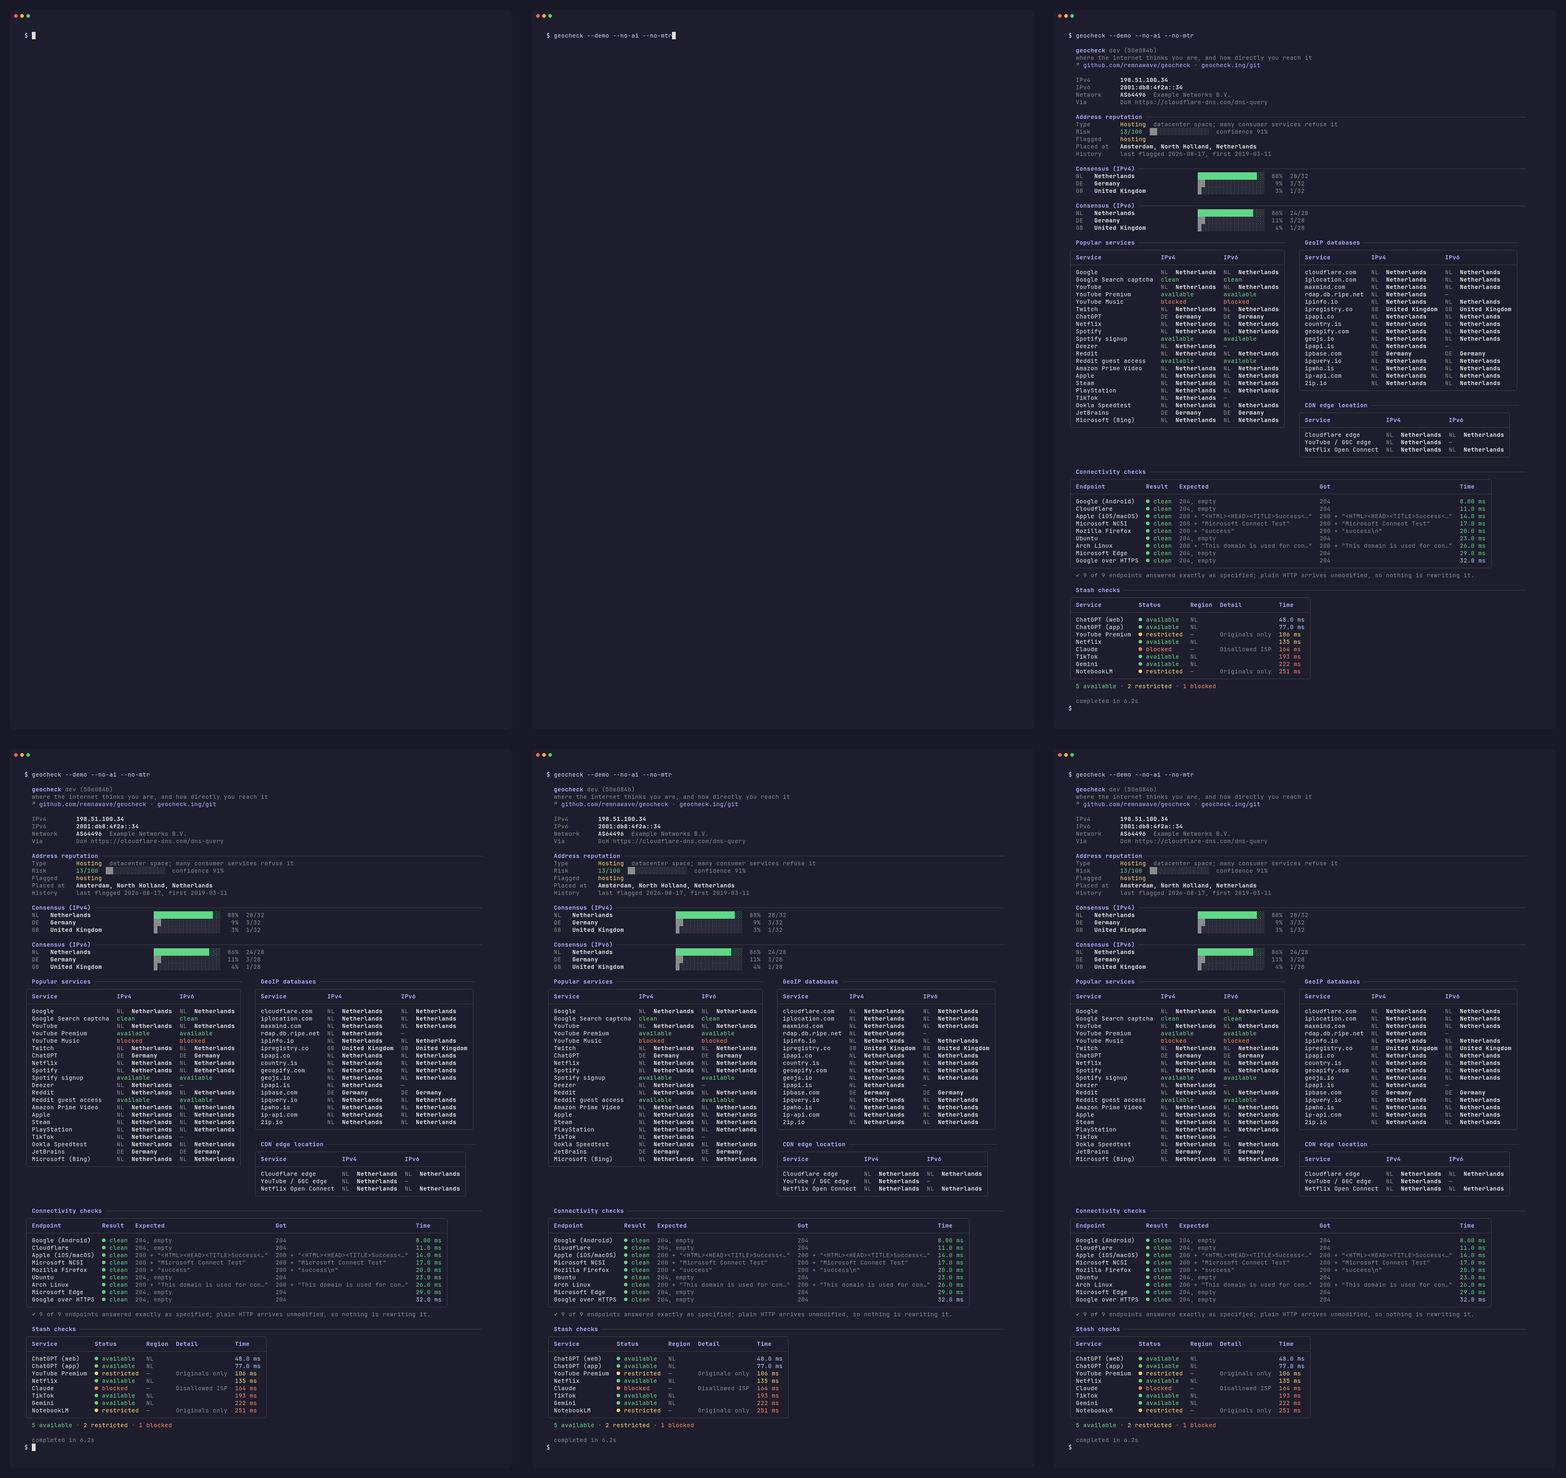
Recorded from geocheck --demo, which renders invented measurements in reserved
documentation address space – so this animation publishes nobody's real address or route. The
path analysis is below.
Every IP geolocation tool answers where does the internet think I am. That is half the question. The other half is how your packets actually get there – whether you enter Google's network on-net or three transit carriers later, whether a tunnel is quietly adding 90 ms, whether something is answering on a destination's behalf.
geocheck answers both, in one pass, and prints the evidence.
The launcher needs nothing installed and leaves nothing behind. It uses docker, else podman, else it downloads the release binary for your platform and verifies its checksum – then removes whatever it pulled or downloaded when the run ends. An image you already had is left untouched.
curl -fsSL https://geocheck.ing | sh

# Flags go after -s --
curl -fsSL https://geocheck.ing | sh -s -- -4 --detail
To pin the runtime instead of letting it choose, name one. It is then a requirement rather than a preference: if it is missing the launcher says so instead of quietly falling through to the next one.
curl -fsSL https://geocheck.ing | sh -s -- --runtime binary   # never a container
curl -fsSL https://geocheck.ing | sh -s -- --runtime docker
curl -fsSL https://geocheck.ing | sh -s -- --runtime podman

# Or as an environment variable, which composes better with a wrapper script
curl -fsSL https://geocheck.ing | GEOCHECK_RUNTIME=binary sh
Launcher options must come first and are not passed on; everything after them
goes to geocheck. sh -s -- --launcher-help lists them.
Prefer to see the command you are running? Straight from Docker Hub:
docker pull remnawave/geocheck:ing
docker run --rm -it --network host remnawave/geocheck:ing
Or as a binary, with no container at all:
go install github.com/remnawave/geocheck/cmd/geocheck@latest| 🛰️ | Address reputation | Datacenter or residential, known VPN or proxy, and a risk score. Usually the thing that explains a refusal the geolocation table cannot. |
| 🌍 | Geolocation consensus | Asks ~40 GeoIP APIs and consumer services which country they serve you, and shows exactly where they disagree. |
| 📶 | Connectivity checks | Runs the endpoints operating systems use to decide they are online – Google's generate_204, Apple's hotspot-detect, Microsoft's NCSI – and compares each answer against the response its vendor specifies. |
| 🧭 | Path analysis | Traces the route to the major networks, annotates every hop with its autonomous system, and judges how directly each one is reached. |
| 🎬 | Service availability | Asks Netflix, ChatGPT, Gemini, NotebookLM, YouTube Premium, Claude and TikTok whether they will actually serve you. |
It also checks whether the measurement itself is being tampered with – a tunnel carrying your default route, a resolver answering on someone else's behalf – because those invalidate everything above them.
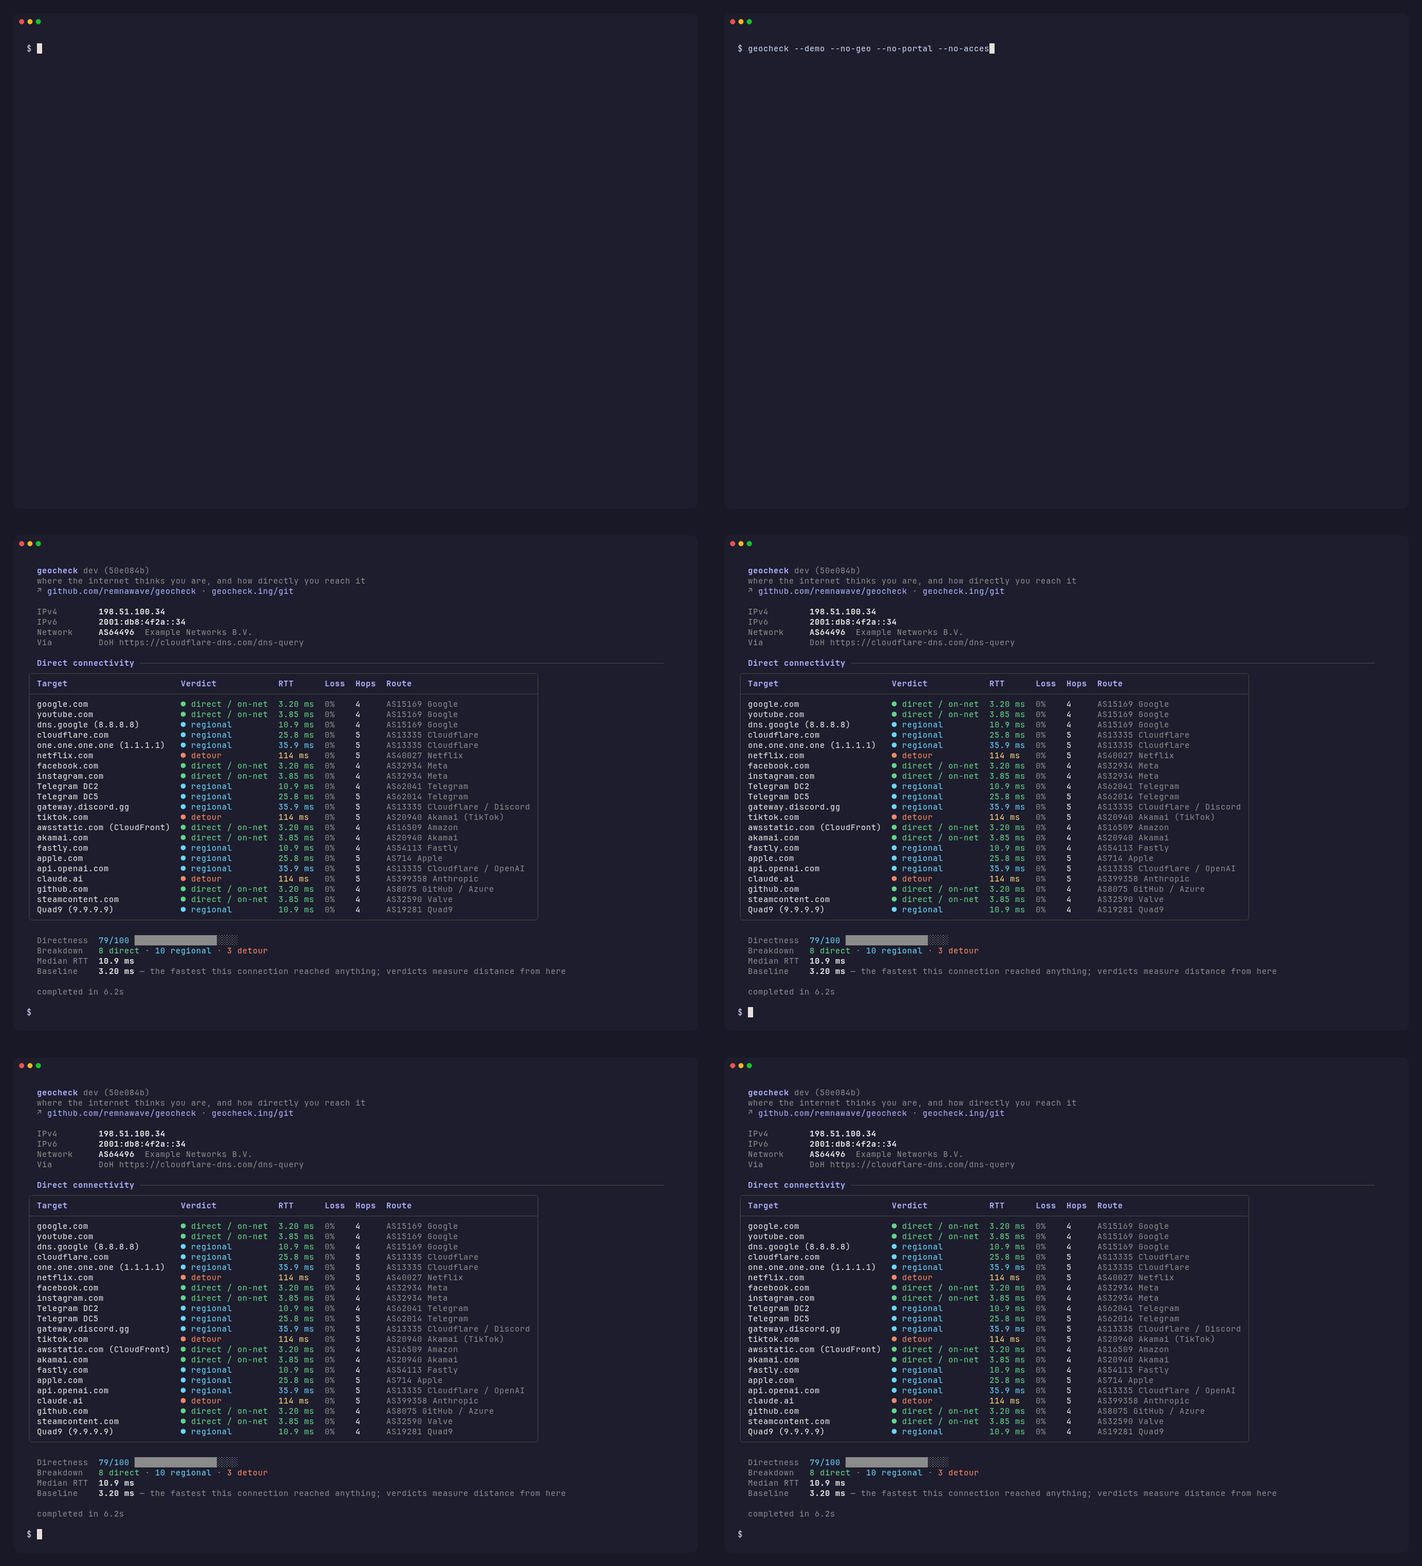
Latency alone cannot tell you whether a connection is direct – a well-peered DSL line idles higher than a badly-routed fibre one. So every verdict is measured relative to the floor: the fastest round trip this connection achieved to anything at all. That floor is the cost of your access network, which no amount of good peering gets below. What the excess above it buys you is information.
| Verdict | What it means |
|---|---|
direct / on-net |
The destination network is entered without crossing a transit provider, at the best latency this connection achieves anywhere. |
regional |
Entered without transit, but from further away – a regional exchange rather than an on-net cache. |
transit |
One or more transit carriers sit between you and the destination network. |
detour |
The traffic travels far further than the destination warrants – typically a tunnel exiting in another region. |
intercepted |
Something answered on the destination's behalf, far closer than the destination can possibly be. |
unreachable |
Nothing answered at all. |
Which Telegram data centre serves you is fixed by where the account was
registered, not by where you are, so a European user can legitimately be pinned
to a US one. The five data centres sit in only three networks, so the default
set traces one per network — DC2 and DC5. Use -T telegram for all five.
# Everything, both address families
docker run --rm -it --network host remnawave/geocheck:ing

# IPv4 only, with every hop of every path
docker run --rm -it --network host remnawave/geocheck:ing -4 -d

# Machine-readable
docker run --rm --network host remnawave/geocheck:ing --json > report.json

# Just "is my connection direct" – skip the geolocation half
docker run --rm -it --network host remnawave/geocheck:ing --no-geo

# Trace every target in the catalogue
docker run --rm -it --network host remnawave/geocheck:ing -T all -d

# See a sample report without measuring anything
docker run --rm -it remnawave/geocheck:ing --demo
Use -it so colours and the progress line render; drop it when piping.
Why --network host is in every example
Without it the container gets its own network namespace, so the trace starts at Docker's bridge instead of your real gateway, and the exit address is whatever the host happens to SNAT to rather than one you can choose. On Linux it makes the measurement describe the host; on macOS and Windows the "host" is a Linux VM, so it shares that VM's namespace instead and buys you less.
Under podman, add --cap-add=NET_RAW
Docker grants that capability by default and podman does not. Without it geocheck cannot open the raw socket the path trace needs – it still runs, but reports latency only, with no hops.
podman run --rm -it --network host --cap-add=NET_RAW remnawave/geocheck:ingThe geocheck.ing launcher passes it for you.
Choosing which address is measured
On a host with several addresses, the one geocheck reports is whichever the kernel picks by default. To measure a specific one, name it:
docker run --rm -it --network host remnawave/geocheck:ing -i 203.0.113.10-i accepts an interface name or any address assigned to the host, so you
can compare what two uplinks, two tunnels, or two of a server's many addresses
actually see. It pins the source of every socket – HTTP checks, DNS and ICMP
probes alike. This needs --network host: without it the container cannot see
the host's addresses at all.
Running the binary, and the raw-socket privilege
go install github.com/remnawave/geocheck/cmd/geocheck@latestOr download one from the releases page.
Hop-by-hop tracing needs a raw ICMP socket. The container image already carries
the capability, so docker run needs nothing beyond the flags above. For a
plain binary, grant it once:
sudo setcap cap_net_raw+p ./geocheck     # Linux
sudo ./geocheck                          # macOS
Without the privilege it still works – it measures destination latency over a TCP handshake instead of walking the path, and says so in the output.
geocheck [options]

  -4, --ipv4              test IPv4 only
  -6, --ipv6              test IPv6 only
  -i, --interface IF|IP   bind all traffic to an interface name or a local source address
  -p, --proxy HOST:PORT   route checks through a SOCKS5 proxy
      --doh MODE          DoH resolver: auto (default), off, or an https:// URL
  -t, --timeout SEC       per-request timeout (default 8)
  -g, --group GROUP       geo groups to run: all, services, geoip, cdn
  -T, --targets SET       trace targets: a tag, an id, 'all', or a comma-separated list
      --portal SET        connectivity-check set: a tag, an id, or 'all'
  -d, --detail            print the full per-hop table for every target
      --rounds N          probes per hop (default 5)
      --max-ttl N         maximum TTL (default 30)
      --no-geo            skip geolocation checks
      --no-mtr            skip connectivity checks
      --no-detect         skip tunnel and DNS interception checks
      --no-portal         skip the captive-portal connectivity checks
      --no-access         skip the service-availability checks
      --no-reputation     skip the address reputation lookup
      --proxycheck-key K  proxycheck.io API key ($PROXYCHECK_API_KEY)
      --mask              mask the public address in the output
  -j, --json              emit JSON
      --svg FILE          write the report as a self-contained SVG (- for stdout)
      --svg-base64        write that SVG base64-encoded to stdout
      --svg-data-uri      write it as data:image/svg+xml;base64,... ready to paste
  -q, --quiet             suppress progress output
      --demo              render a sample report from invented data
Target tags: default, web, video, dns, cdn, social, messaging,
cloud, ai, dev, gaming, google, telegram, all. You can also name a
specific target, e.g. -T cloudflare_dns,telegram.
--json emits a stable, versioned document for scripting. It is written
compact, on one line — pipe it through jq . when you want to read it:
geocheck --json | jq '.connectivity.targets[] | select(.verdict != "direct") | {name, verdict, rtt_ms}'
geocheck --json | jq -r '.consensus.ipv4[0] | "\(.country) \(.percent)%"'
geocheck --json | jq '.findings[] | select(.severity == "alert")'
geocheck --json | jq '.reputation | {type, risk, flags}'
Top-level keys: schema, tool, timestamp, duration_ms, identity,
transport, findings, reputation, consensus, geo,
connectivity_checks, connectivity, stash_checks.
--demo --json produces the same document from the sample data, which is a
convenient fixture to develop against.
Pasting a terminal report into a chat window usually destroys it — the colours
go, and the box drawing wraps into rubble. --svg renders the same report as an
image instead.
geocheck --svg report.svg          # to a file
geocheck --svg -                   # to stdout
geocheck --svg-base64              # bare base64
geocheck --svg-data-uri            # the same, wrapped and ready to paste
geocheck --svg-data-uri | pbcopy   # macOS: straight to the clipboard
--svg-data-uri writes what an <img> or a browser address bar takes as-is:
<img src="data:image/svg+xml;base64,PHN2ZyB4bWxucz0i...">Two documents cannot share one stdout, so combining --json with a picture puts
the picture inside the document rather than next to it:
geocheck --json --svg-data-uri > report.json

jq -r .image.data report.json | base64 -d > report.svg
jq -r '"data:\(.image.media_type);\(.image.encoding),\(.image.data)"' report.json
{
"schema": 1,
"identity": { "ipv4": "198.51.100.34", "...": "..." },
"connectivity": { "score": 92, "...": "..." },
"image": {
"format": "svg",
"media_type": "image/svg+xml",
"encoding": "base64",
"data": "PHN2ZyB4bWxucz0i..."
}
}The block above is shown laid out for reading; the real output is one compact
line. The parts are separate fields rather than one pre-built URI so nothing is
duplicated — a report carrying the picture twice would be 240 KB of mostly the
same bytes. image is absent unless a picture was asked for.
--json --svg FILE is the other useful pairing: the document goes to stdout and
the picture to the file, neither competing for the stream. --json --svg - is
refused, because that genuinely cannot be parsed.
The document is self-contained: JetBrains Mono is embedded inside it, so there is nothing to fetch when it is displayed and it looks the same wherever it is opened. That matters more than it sounds — the report is drawn almost entirely with box-drawing and block characters, and a viewer whose default monospace font lacks them shows broken frames. About 27 KB of the file is the font, subset to the characters the report can actually emit.
Every run of text is placed by column number rather than by measuring it, so
even a renderer that ignores embedded fonts keeps the columns aligned and only
substitutes the glyphs. One such renderer is rsvg-convert: it ignores
@font-face with a data: URI, where browsers honour it.
Ligatures are disabled deliberately. JetBrains Mono would otherwise draw ->
and -- as single glyphs, quietly rewriting hostnames and flag names in a
picture people read as a transcript.
--demo --svg renders the sample report instead of measuring anything, which
is a quick way to see the output before running a real check.
See DEVELOPMENT.md for the build, the repository layout, the release process and the known limitations.
This project stands on work done by others:
- ipregion by Davoyan, and vernette/ipregion before it
- StashNetworks/misc
- v2fly/domain-list-community
- proxycheck.io and Team Cymru for keeping their services usable without an account
- charmbracelet/vhs, which records the animations above
MIT – see LICENSE.