This project presents an interactive Power BI dashboard designed to analyze sales performance, customer behavior, and product insights.
The dashboard is divided into two pages:
- Executive Overview – high-level business insights
- Detailed Analysis – in-depth data exploration
- Analyze overall sales performance
- Track monthly sales trends
- Identify top customers
- Understand product category contribution
- Evaluate regional performance
- Measure customer retention and activity
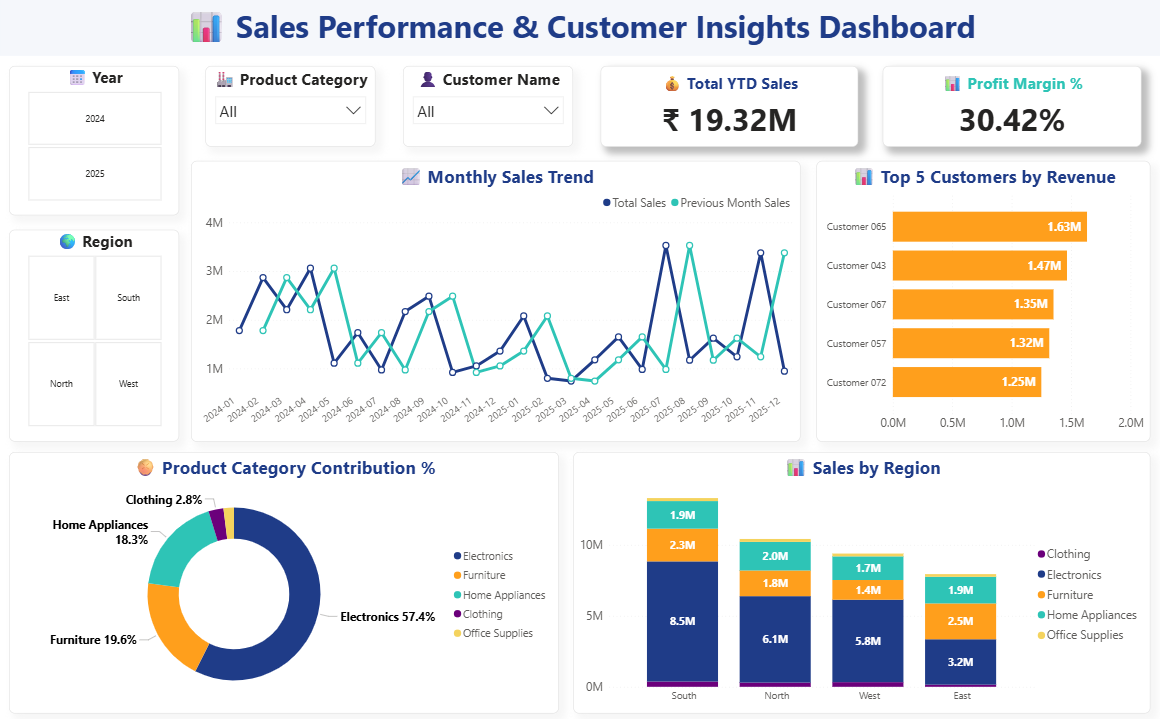
This page provides a high-level summary for decision-makers.
- Total YTD Sales
- Profit Margin %
- Shows sales trend over time
- Compares current vs previous month
- Identifies highest revenue-generating customers
- Displays % contribution of each category
- Region-wise performance breakdown
- Includes category-wise distribution
- Year
- Region
- Product Category
- Customer Name
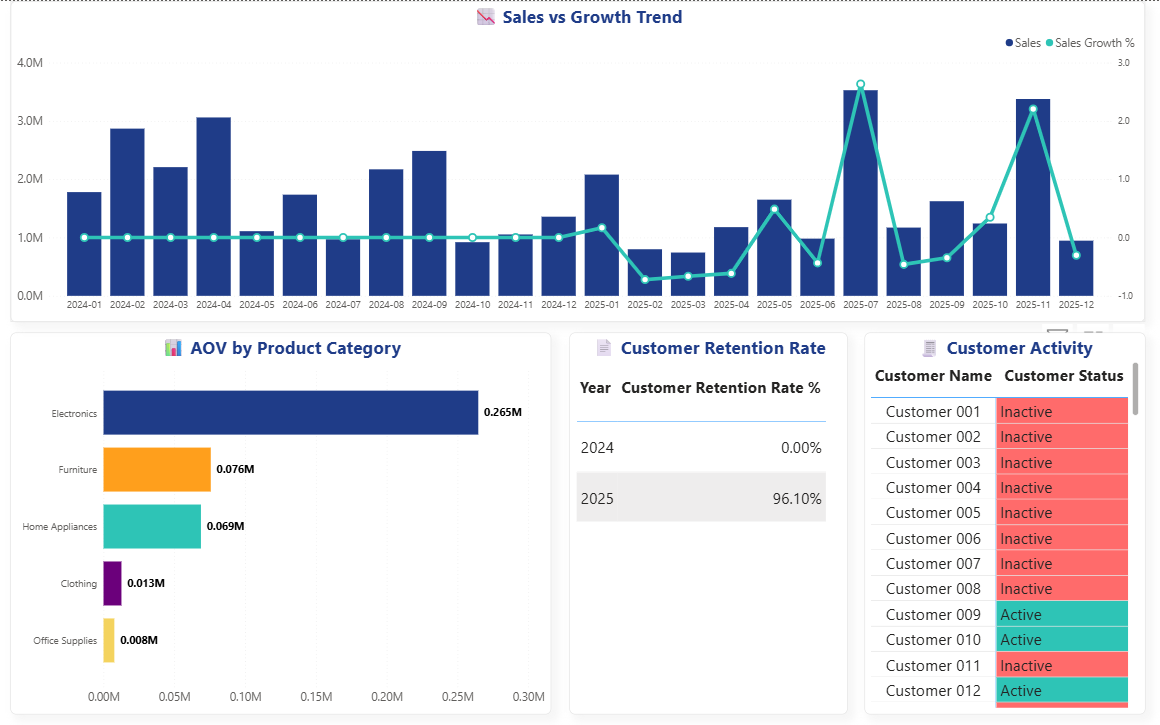
This page focuses on deeper insights and customer behavior.
- Compares total sales with growth percentage
- Uses secondary axis for clarity
- Shows category-wise average order value
- Year-wise retention comparison
- Helps evaluate customer loyalty
-
Classifies customers as:
- Active
- Inactive
- Electronics category contributes the highest revenue
- Certain regions outperform others significantly
- Top customers contribute a large share of revenue
- Customer retention is strong in recent years
- Sales show noticeable fluctuations across months
- Power BI Desktop
- DAX (Data Analysis Expressions)
- Data Modeling & Relationships
- Interactive Visualizations
- Total Sales
- Previous Month Sales
- Sales Growth %
- Average Order Value (AOV)
- Customer Retention Rate
- Customer Status (Active/Inactive)
- Clean and structured layout
- Consistent color palette
- Interactive slicers
- KPI-focused design
- Professional dashboard styling
This dashboard provides:
- 📊 Clear data visualization
- ⚡ Real-time interactivity
- 🎯 Business-focused insights
It helps users:
- Understand trends
- Compare performance
- Identify opportunities
This project demonstrates skills in:
- Data Analysis
- Data Visualization
- Dashboard Development using Power BI
⭐ If you found this project useful, feel free to give it a star!