===============================================
I have used three libraries with three different languages, including:
- Javascript + D3
- Python + Seaborn
- R + ggplot2
And additional two tools:
- Flourish
- Tableau Desktop
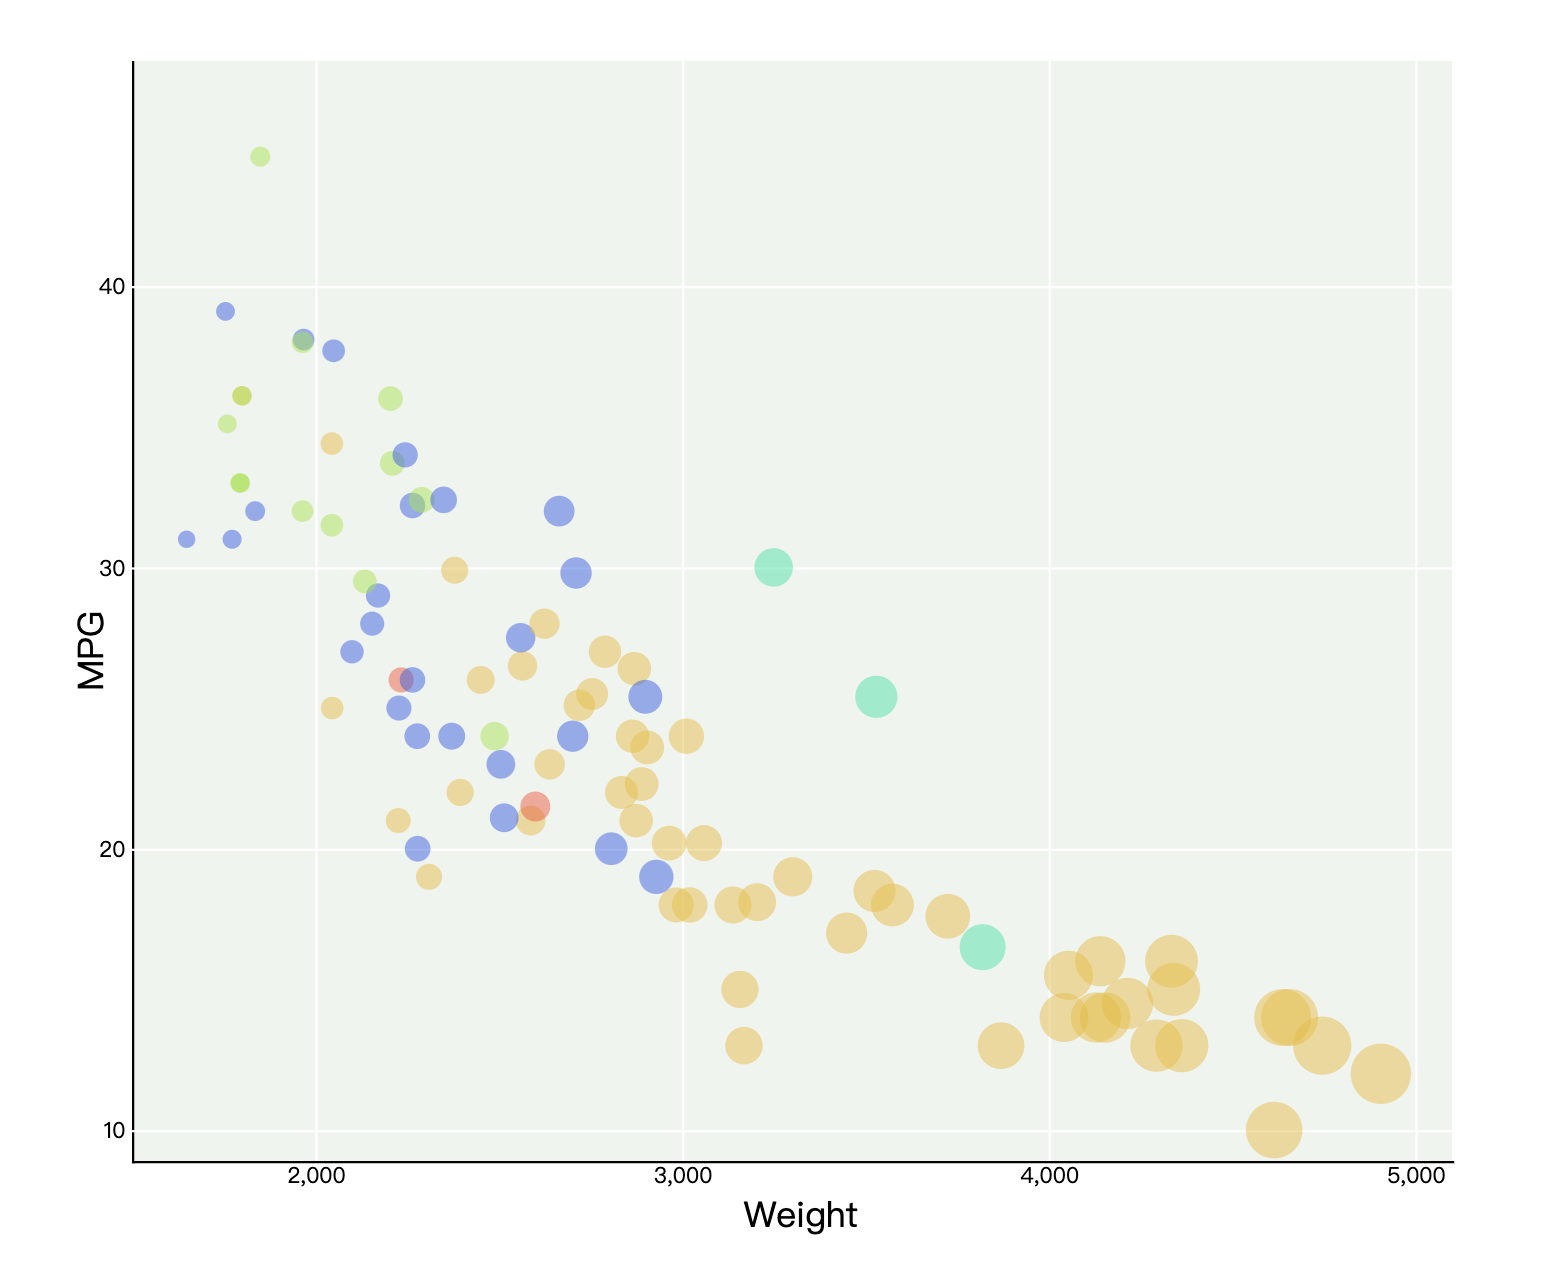
D3.js is a JavaScript library for manipulating documents based on data. D3 helps us bring data to life using HTML, SVG, and CSS. D3’s emphasis on web standards gives us the full capabilities of modern browsers without tying ourselves to a proprietary framework, combining powerful visualization components and a data-driven approach to DOM manipulation.
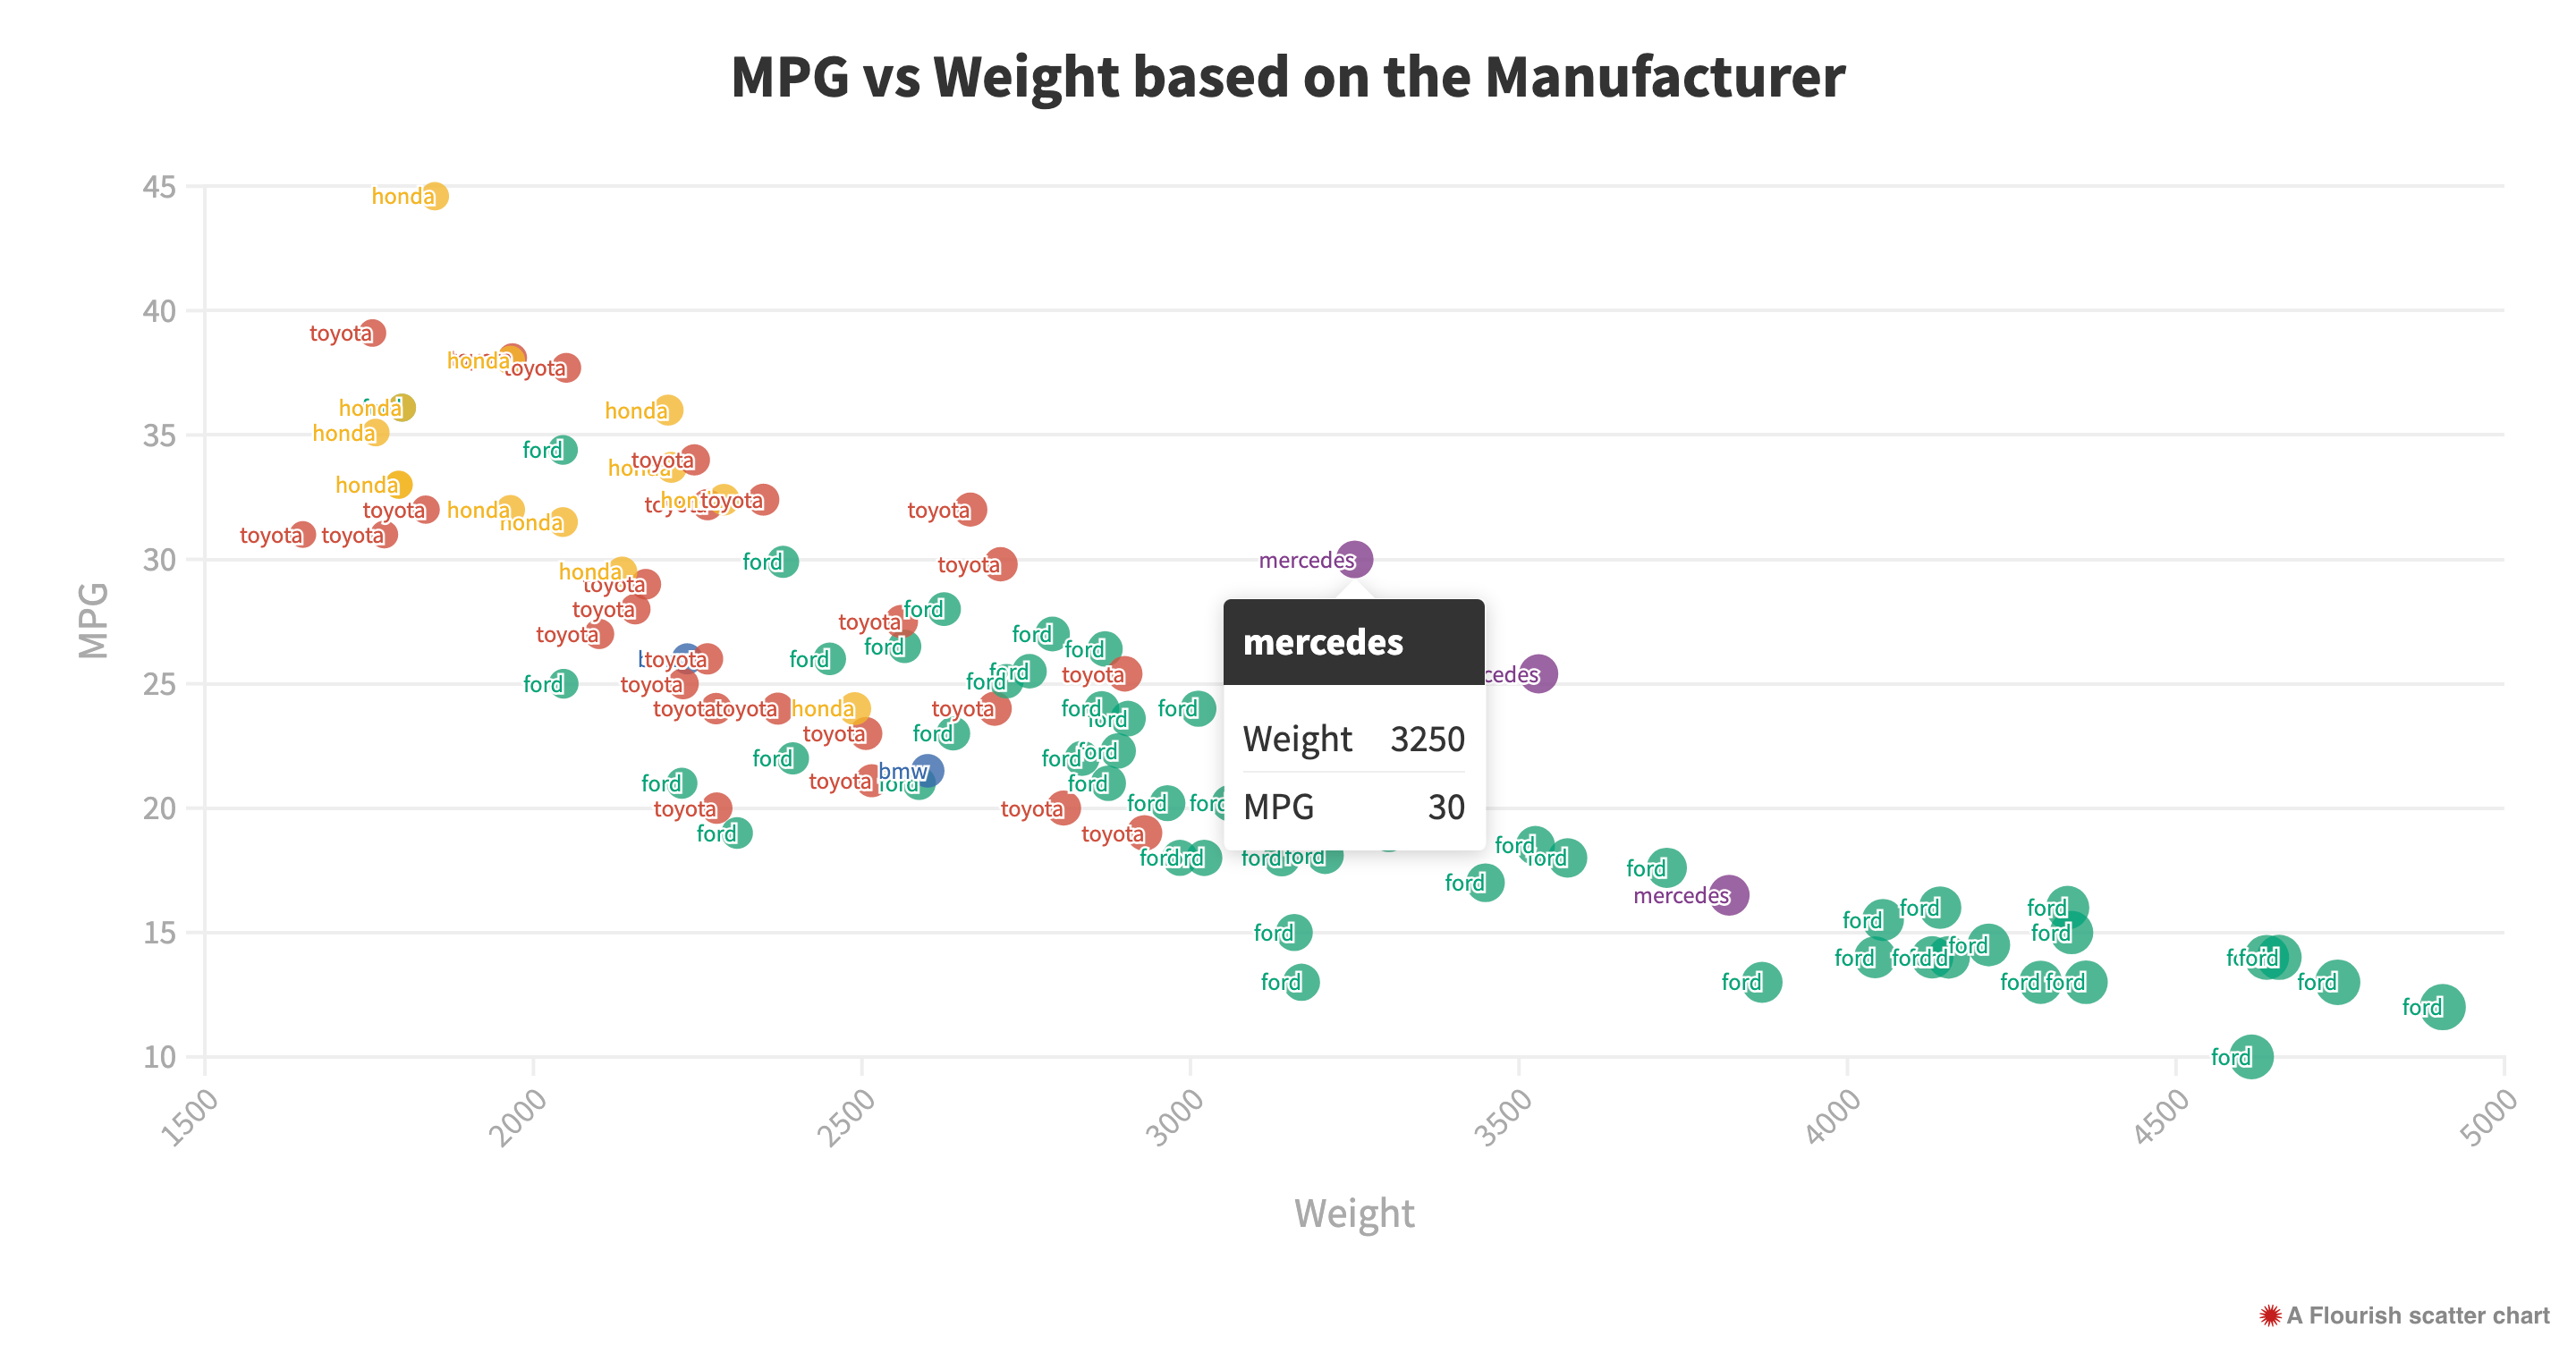
Flourish is an online data visualization tool. It’s easier to use than Tableau, and most importantly, it’s free. For individuals, Flourish is good enough. But for companies and organizations, Tableau is better.
Matplotlib is a plotting library for the Python programming language and its numerical mathematics extension NumPy. It provides an object-oriented API for embedding plots into applications using general-purpose GUI toolkits like Tkinter, wxPython, Qt, or GTK+.
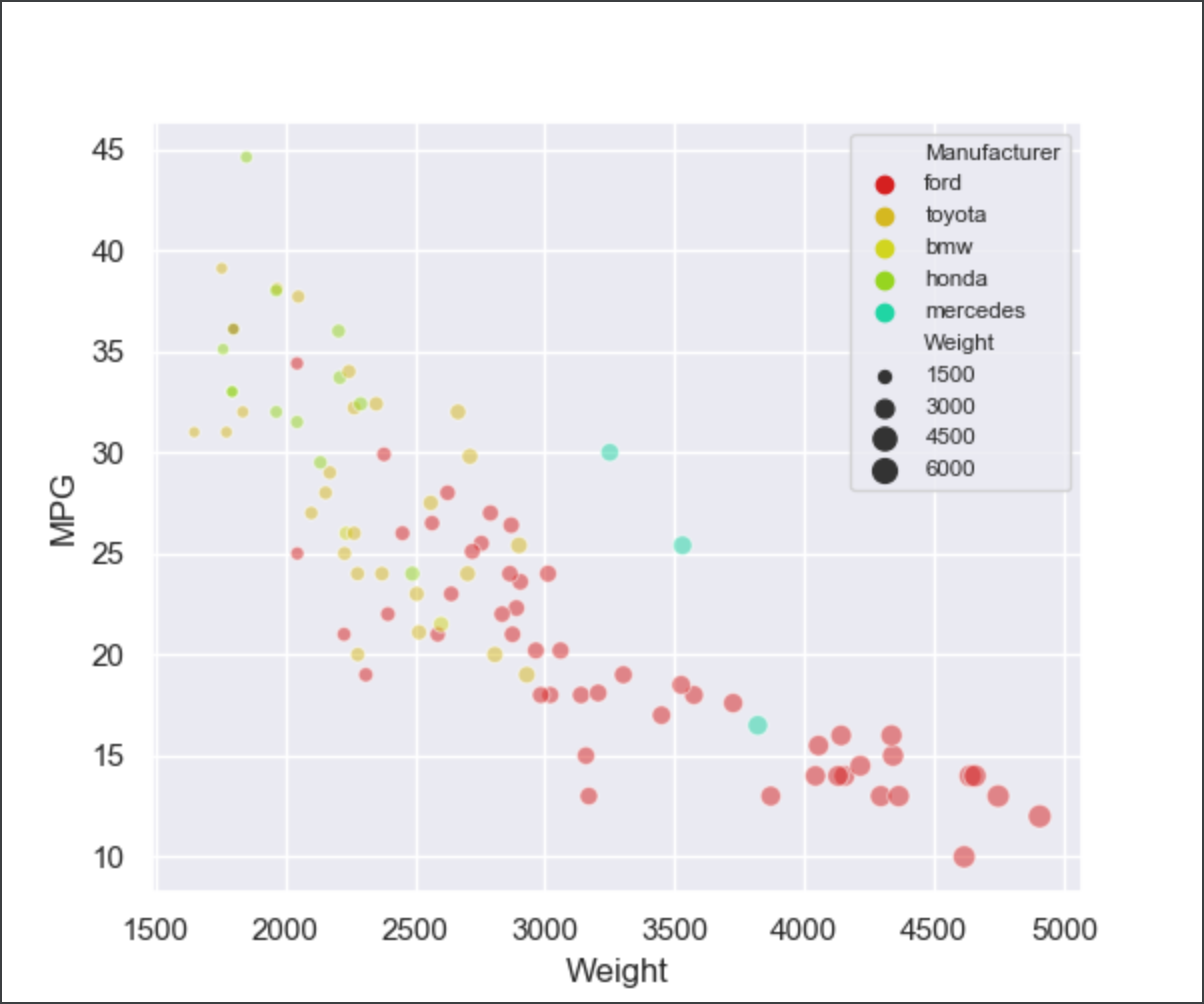
Seaborn is a Python data visualization library based on matplotlib. It provides a high-level interface for drawing attractive and informative statistical graphics.
I use pandas.read_csv() to load data, then use seaborn.scatterplot() to plot graphics. Finally, I will use plt.show() to show result.
- R is a language primarily focused on statistical computing.
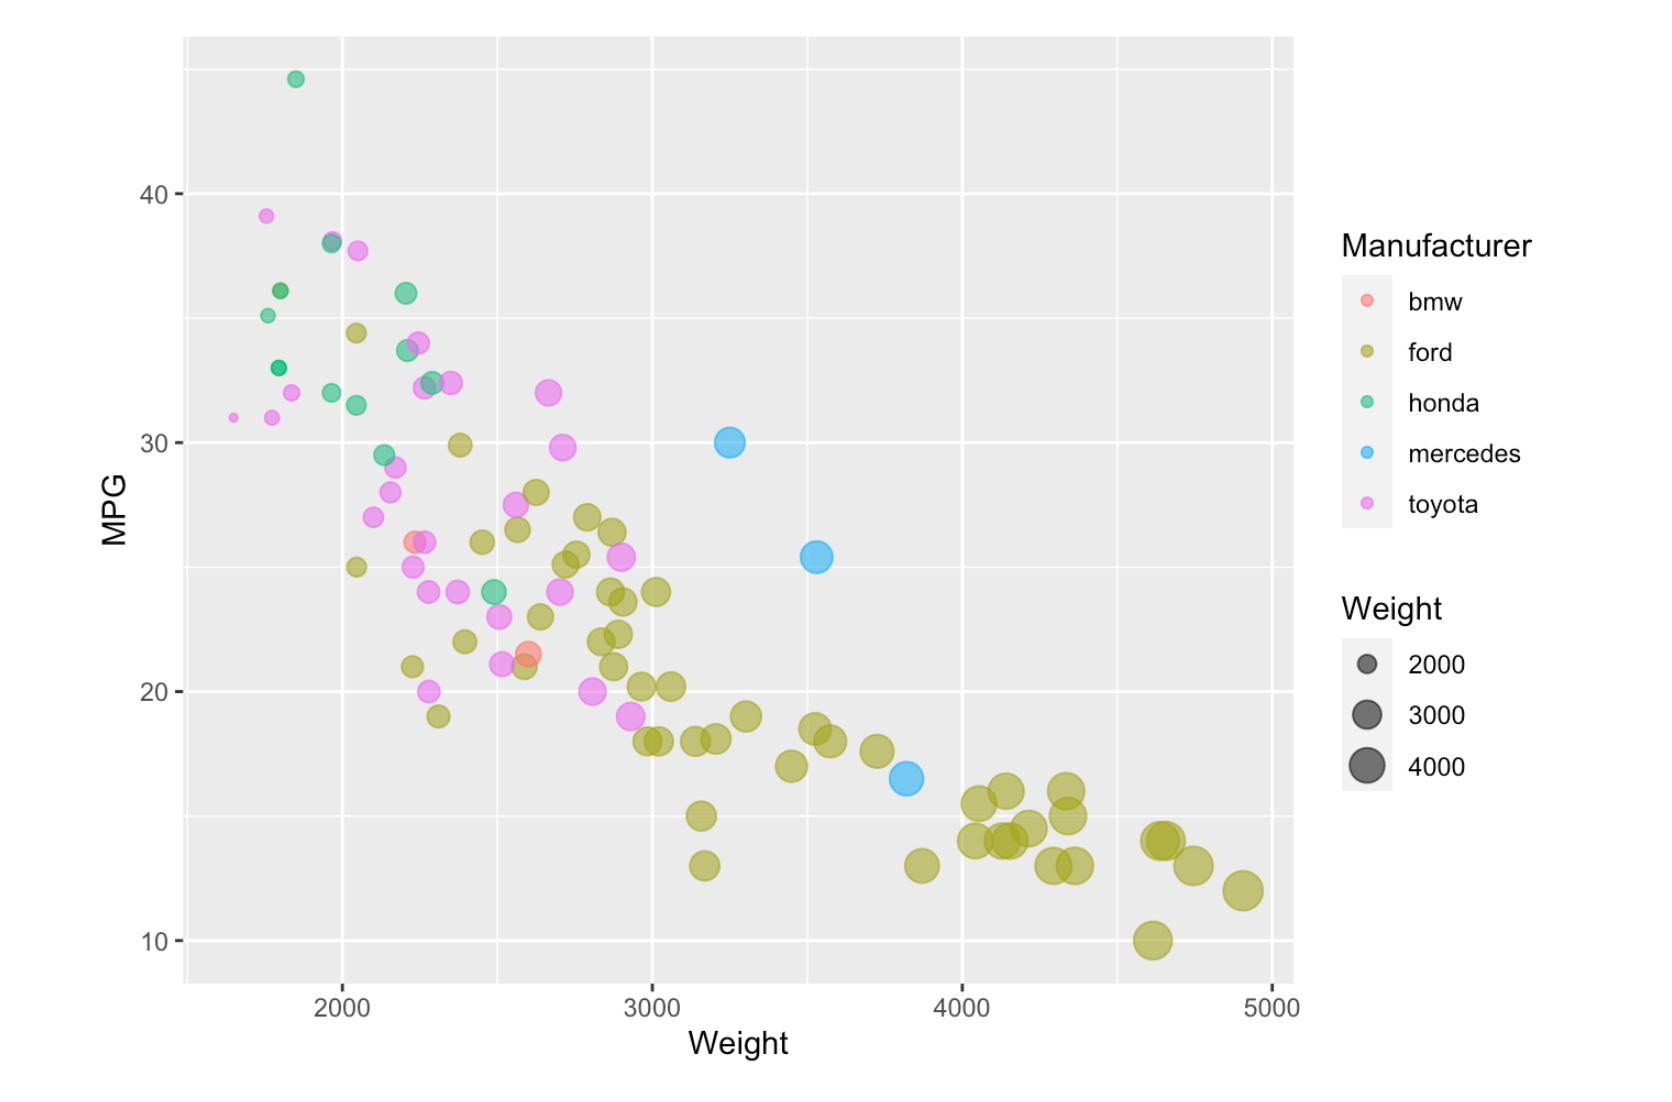
- GGPlot2 is a system for declaratively creating graphics, based on The Grammar of Graphics. You provide the data, tell ggplot2 how to map variables to aesthetics, what graphical primitives to use, and it takes care of the details.
- R Markdown is a document format that compiles to HTML or PDF and allows you to include the output of R code directly in the document.
I used geom_point() layer to visualized the dataset. And outputed the R-markdown file as HTML format.
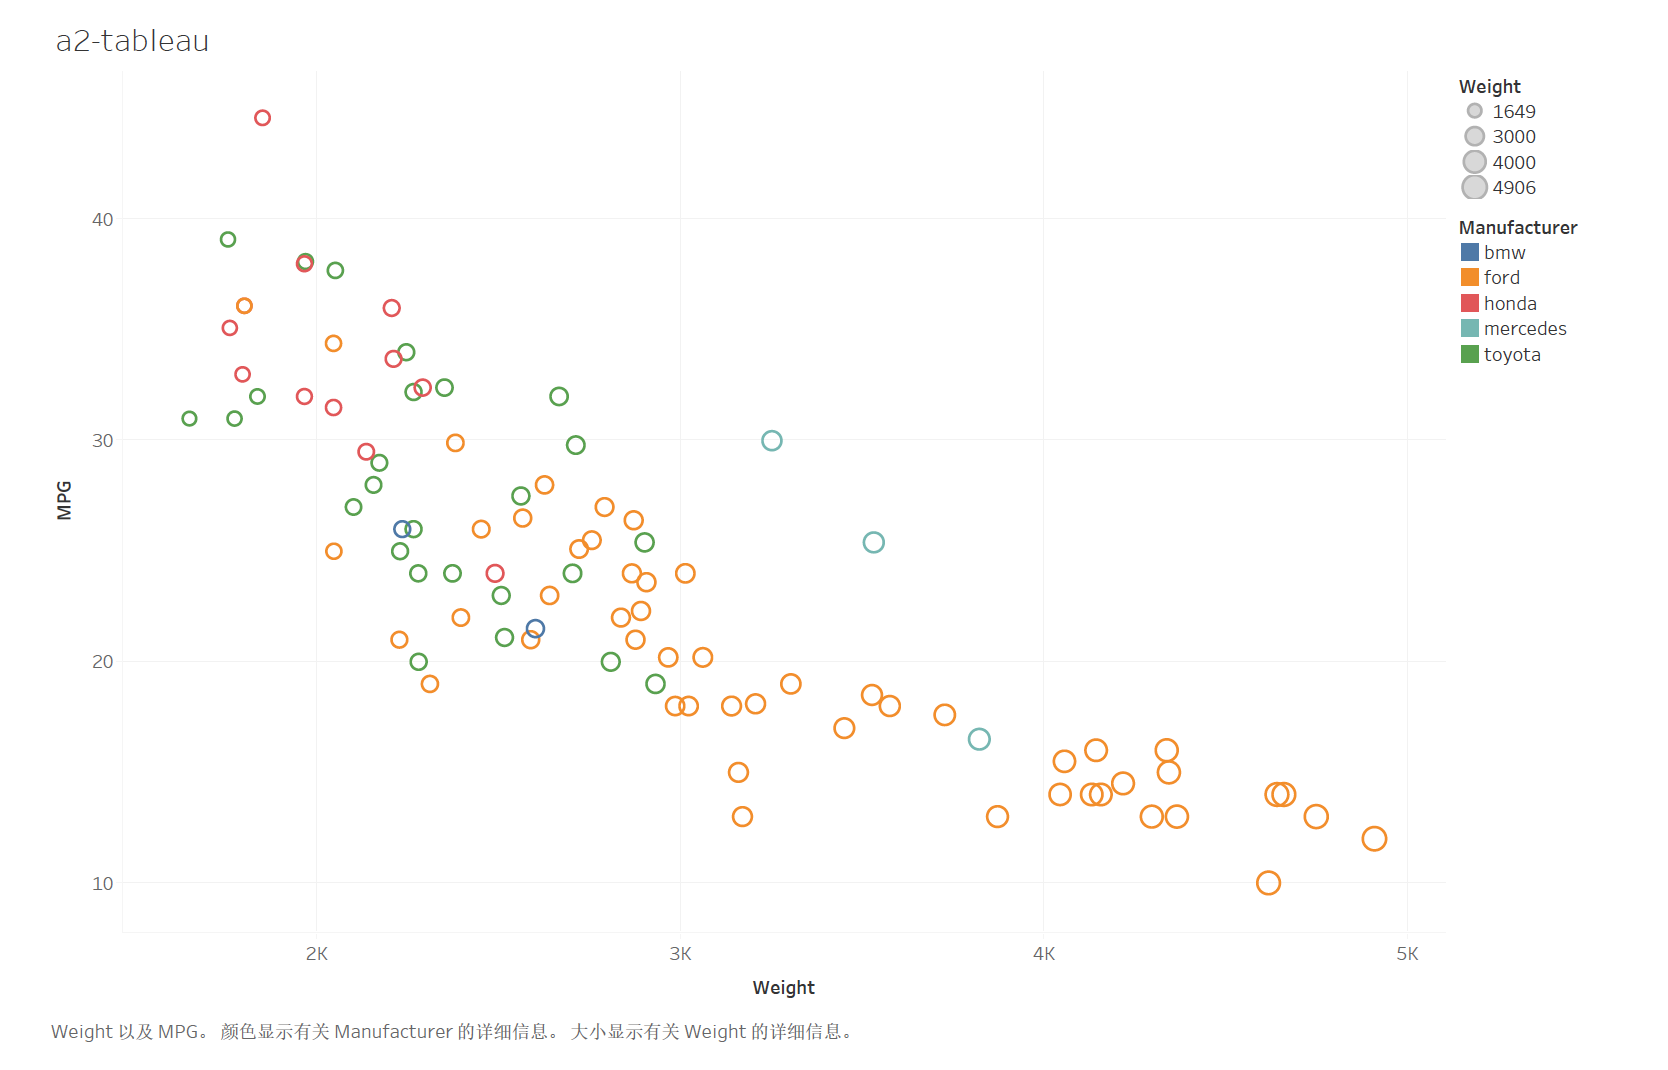
Tableau Desktop is data visualization software that lets you see and understand data in minutes.